What a Real Quality Culture in Engineering Looks Like
Quality culture is the state where the engineering organization defaults to caring about quality on its own — without a QA team standing at the door enforcing it. It is the difference between a developer who closes a ticket only after writing a test, and one who closes a ticket and waits for QA to catch what they missed. Quality culture is not a poster or a quarterly all-hands theme. It is a set of habits — shared ownership, fast feedback loops, visible metrics, a budget for known-issue debt, and engineering values that explicitly name quality — that compound until caring about quality is the path of least resistance.
Key takeaways
- A quality culture exists when developers default to writing tests, triaging their own bugs, and treating production health as their problem — not when QA enforces quality on their behalf.
- Most "quality initiatives" fail for three reasons: top-down mandates, symbolic activities with no follow-up, and metrics that punish bug discovery.
- The five building blocks: shared ownership, defect feedback loops, visible metrics, a quality budget, and engineering values that name quality.
- The CTO owns the conditions. The QA lead owns the practice. Confusing the two collapses the culture.
- The composite Series B fintech in the case study below cut escaped defect rate by 62% and improved customer-reported NPS by 14 points in six months by changing rituals, not headcount.
Why Most Quality Initiatives Fail
A leadership team sees its own escaped defect rate creeping up and decides to invest in quality. A slide deck circulates, posters appear in Slack, a monthly bug-bash lands on the calendar. Six months later the metrics look identical and the engineers are quietly cynical.
The reason is structural. Quality initiatives fail when they treat culture as a communications problem. Three patterns recur:
The top-down mandate. Leadership announces a push without consulting engineers. It lands as one more thing on top of the velocity they were already measured on, and is the first thing dropped when the sprint runs hot.
The symbolic event. A bug-bash with pizza, no follow-up, no change to the workflow that let the bugs through. Engineers learn that quality is theatre.
The wrong metric. A scorecard that rewards low bug counts. The fastest way to lower a bug count is to stop logging bugs. Metrics that punish discovery turn the org into expert hiders of problems.
The fix is rebuilding the system so quality is the default, not the override.
The Five Building Blocks
A durable quality culture rests on five reinforcing practices. Skip one and the rest leak.
1. Shared ownership
The most consequential shift: developers write tests for their own code and triage their own bugs. Quality stops being a department and becomes a property of the work.
Google has built this into its engineering DNA for almost two decades. In Software Engineering at Google, the Testing chapter is explicit: product teams own quality, not a separate test team. Every change requires review, every review is expected to include tests, and reviewers can block changes that lack them.
In practice: the developer who writes the feature writes the tests. The developer who shipped the bug owns the fix and the post-mortem, with QA in support. The on-call rotation is engineers, not testers. QA shifts from guard at the gate to embedded coach — designing test strategy, mentoring on what to test, owning the harder exploratory work.
This is the central premise of shift-left testing. It does not work as a directive. It works when the rituals around it make it impossible to ship without it.
2. Defect feedback loops
Every escaped bug is a teacher. Teams that learn from them close the loop. Teams that do not ship the same class of bug again next quarter.
The minimum viable ritual is a one-page root cause document for every escaped bug — no blame, four sections: what happened (symptom and timeline), why it happened (proximate cause and system factors), what we are changing (a specific test, check, or process change — not "be more careful"), and what we are not changing, and why.
The 2024 DORA report formalised this as the rework rate — the share of deployments that exist only to fix something that escaped. The 2024 DORA findings showed a strong correlation between rework rate and change failure rate, and AI-assisted development has widened the gap as code volume outpaces review capacity. The broader picture is in the state of QA 2026 trends.
3. Visible metrics
Quality has to live where engineers look every day, or it stops mattering. Three metrics are worth pinning up:
- Bug burn-down — open bugs by severity, trending over time. A burn-down going the wrong way is the earliest leading indicator of culture drift.
- Escaped defect rate — bugs found in production divided by bugs found total. A team finding 70% in production has a broken test strategy. A team finding 5% has either a healthy culture or a hidden one.
- MTTR per service — broken out by service so individual squad performance is visible.
Where the metrics live matters as much as what they are. A Grafana dashboard nobody opens does nothing. Post them in a daily Slack channel, in the monthly engineering all-hands deck (owned by whichever squad had the worst service), and as a 30-second standup check once a week.
A common failure mode: leadership wants the metrics but does not want anyone exposed by them, so dashboards aggregate at the org level only. That defeats the point. Visible metrics work because they create gentle peer-level accountability — not because they generate leaderboard rankings.
4. A quality budget
SREs run on an error budget — a defined tolerance for unavailability the team can spend on velocity. The same logic works for quality debt.
A quality budget is the explicit tolerance for known-issue debt. Typical starting ceiling: no more than 20 open P2 bugs per squad and zero P0/P1 bugs older than 7 days. Every bug logged consumes from the budget; every fix restores it. Above the ceiling, the next sprint is a bug-fix sprint. No executive override — that is the whole point.
A quality budget changes the political dynamic of bug triage. Without one, every bug is a negotiation between QA and product. With one, the budget makes the decision. The team that ships clean code earns velocity. The team that ships buggy code earns a stabilisation sprint. Cause and effect become legible.
5. Engineering values that name quality
Most company values are abstract — "be customer-obsessed," "move fast." Quality cultures name quality explicitly, in language that survives a code review comment.
Compare "we care about quality" with "we do not ship code without tests; we do not close a bug without a root cause note; we page the developer who shipped the issue, not the on-call rotation." The second is a value. The first is a poster. Engineers can use the second to argue for time. They cannot do anything with the first.
Names worth naming explicitly:
- Tests are part of the change, not a follow-up. A PR without tests is not ready for review.
- Bugs you ship are bugs you own. Triage, root cause, fix — the original author leads.
- No blame in post-mortems. No avoidance either. Change the system, but do not skip naming what happened.
- Quality debt is debt. It accrues interest. Pay it down deliberately.
The CTO Role vs the QA Lead Role
Who owns quality at the org level? The CTO owns the conditions, the QA lead owns the practice. Mix the two and you get either quality theatre under an absent CTO or an over-empowered QA team that becomes a bottleneck.
| Responsibility | CTO / Head of Engineering | QA Lead / Head of QE |
|---|---|---|
| Sets the engineering values | Yes — and defends them publicly | Contributes the quality-specific language |
| Owns the quality budget policy | Yes — defines spend rules and ceilings | Operates the budget day to day |
| Owns metrics visibility | Yes — funds the dashboards and rituals | Designs which metrics matter and why |
| Owns test strategy | No | Yes — what to test, where, with what tools |
| Owns the rituals | Sponsors them, attends them | Designs and runs them |
| Decides on release stops | Yes — final call when budget is breached | Surfaces the data, recommends the call |
| Defends quality work in roadmap | Yes — the single highest-leverage move | Provides the evidence |
The highest-leverage thing a CTO does is defend quality in the roadmap conversation. When the deadline slips and the only thing left to cut is test coverage on the new payments flow, the CTO says no. If the QA lead is the only one saying no, the culture is brittle. For QA leads making the funding case upward, convincing your boss to invest in QA tooling covers the evidence base.
Concrete Rituals That Work
Rituals turn values into habits. Three earn their keep:
Bug-bash days with closed loops. Once per release cycle, the team spends a day trying to break the product. Every bug found gets a root cause note before the day ends; a follow-up review four weeks later closes each one. Pizza without follow-up is the failure mode.
No-blame post-mortems on every escaped defect. A 30-minute meeting. The developer who shipped the bug presents the timeline, the team identifies contributing system factors, three to five actions are committed with owners and dates. The facilitator redirects any sentence starting with "they should have." Output: a one-pager in the engineering wiki, linked from the fix PR.
Quality champion rotation. Each squad nominates a champion for a rolling six-week term. They do not write tests — they attend the cross-squad quality sync, raise risks early, and represent the squad in test strategy discussions. Rotation spreads the perspective rather than concentrating it in one person who burns out.
The Anti-Patterns That Quietly Kill It
A few failure modes look reasonable in isolation and only reveal themselves at scale.
Bug-count shaming. Scorecards ranking developers by bug count. Developers respond by not logging bugs or closing them as "won't fix" to keep the number down. The data degrades, and quality with it.
The QA gate handoff. Developers throw a feature over the wall to QA. Developers stop caring (it is QA's job) and QA becomes the bottleneck. The fix is shared ownership, not a faster QA team.
Blameful post-mortems. Meetings focused on who wrote the bug rather than what allowed it through. The first three of these kill psychological safety. After that, every engineer is incentivised to hide problems rather than surface them.
Punishing bug discovery. Any metric, scorecard, or comment that makes finding a bug feel like a negative event — including the subtle pattern of senior engineers visibly sighing when a new issue is logged.
Quality OKRs nobody owns. "Improve quality by 30%" with no metric, no owner, no budget. Lives on slides forever, changes nothing.
Mandated coverage targets without context. "Hit 90% coverage by Q3" produces the lowest-value tests imaginable — tests that exist only to push the percentage up.
Composite Case Study: A Series B Fintech, Six Months
A 60-engineer Series B fintech — composite of three teams the Crosscheck team has worked with — entered 2026 with the classic QA-gate pattern. A six-person QA team owned regression, triage, and release decisions. Developers shipped code, ran whatever unit tests came with their framework, and considered quality complete. Escaped defect rate sat at 28%. NPS had drifted 11 points down over four quarters. The CTO had the conversation every QA lead recognises: "We need to invest in quality, but we cannot hire."
What the team changed in the next six months — framed not as a quality initiative but as a culture shift:
- Month 1. PR template requires a tests-added checkbox. QA stops first-pass regression on PRs — that is now the developer's job. QA's new mandate: exploratory testing, accessibility, and test strategy.
- Month 2. Every escaped bug gets a one-page root cause document, authored by the developer who shipped it. Patterns start emerging by week 6.
- Month 3. A
#quality-pulseSlack channel posts bug burn-down, escaped defect rate, and MTTR per service daily. Engineering all-hands includes a quality slide owned by whichever squad had the highest rework rate. - Month 4. Each squad gets a quality budget ceiling. The first squad to breach it does a one-sprint bug-fix run. The visible consequence does more for the culture than any all-hands speech.
- Month 5. Bug-bash days, no-blame post-mortems, and a quality champion rotation become routine.
- Month 6. Four values written down on the engineering wiki, referenced in code review comments by the second week.
The six-month numbers (composite, anonymised):
- Escaped defect rate: 28% → 11% (a 62% reduction)
- MTTR (median, P1 incidents): 4.2 hours → 1.6 hours
- Customer-reported NPS: +14 points
- Engineering attrition: 18% → 9% annualised
Neither team grew. What changed was where ownership lived, how the feedback loops closed, and what the team measured publicly.
Linking Culture to Outcomes
Three links between culture and business outcomes worth naming:
Escaped defect rate predicts customer trust. A user who hits a P1 bug in a production fintech app is materially less likely to renew, refer, or expand. The 2024 DORA findings on rework rate make the same point operationally.
Retention follows feedback loops. Engineers stay where their work compounds. A team that ships bugs, gets blamed for them, and re-ships the same class next quarter watches its best people leave. Teams with strong no-blame post-mortem cultures consistently report lower attrition.
Velocity follows quality, not the other way around. A team optimising for velocity at the expense of quality slows down within two quarters as the bug backlog overwhelms feature work. A team that holds the quality line ships more features over twelve months — rework drops, on-call load drops, engineers spend more time building than re-fixing.
Teams that internalise this stop framing quality as a tax on velocity and start framing it as the precondition for it.
FAQ
What is quality culture in software engineering?
Quality culture is the state where the engineering org defaults to caring about quality on its own — developers write their own tests, triage their own bugs, and treat production health as their problem. It is a property of the system of work, not a poster or a value statement.
How do you start building a quality culture from scratch?
Two changes that cost nothing and signal everything. First, require tests on every PR — make the template enforce it and back reviewers who block changes without them. Second, run a no-blame post-mortem on every user-impacting incident with a one-page root cause document. Those two rituals create the conditions for the deeper shifts to land later.
What metrics should we use to measure quality culture?
The three that matter most: escaped defect rate (bugs found in production divided by total bugs), MTTR per service, and bug burn-down. Make them visible daily in a Slack channel and monthly in engineering all-hands. Avoid metrics that punish discovery — bug count per developer is a classic mistake.
Should the CTO or the QA lead own quality culture?
Both, with different scopes. The CTO owns the conditions — values, budget, willingness to slip a deadline rather than ship broken. The QA lead owns the practice — test strategy, rituals, what to measure. When the QA lead is the only person defending quality, the culture is fragile and rarely survives them leaving.
How long does it take to build a real quality culture?
Six months for the metrics to shift if leadership commits fully. Eighteen months for the culture to be self-sustaining — for a new developer who joins to inherit the values rather than be taught them.
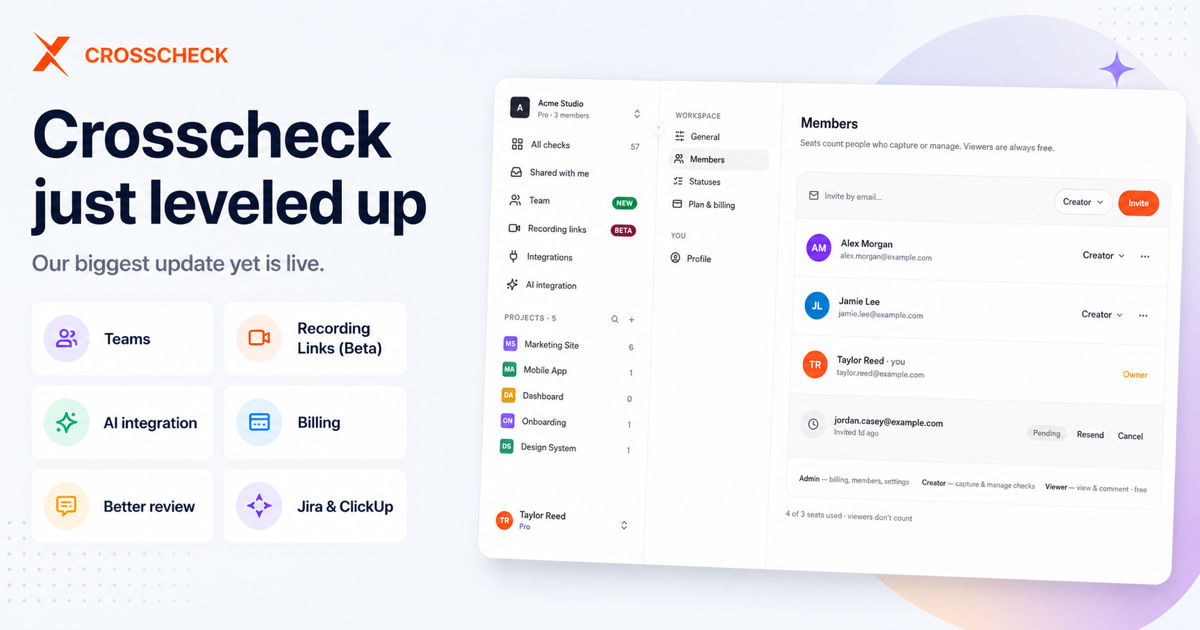
Where Crosscheck Fits
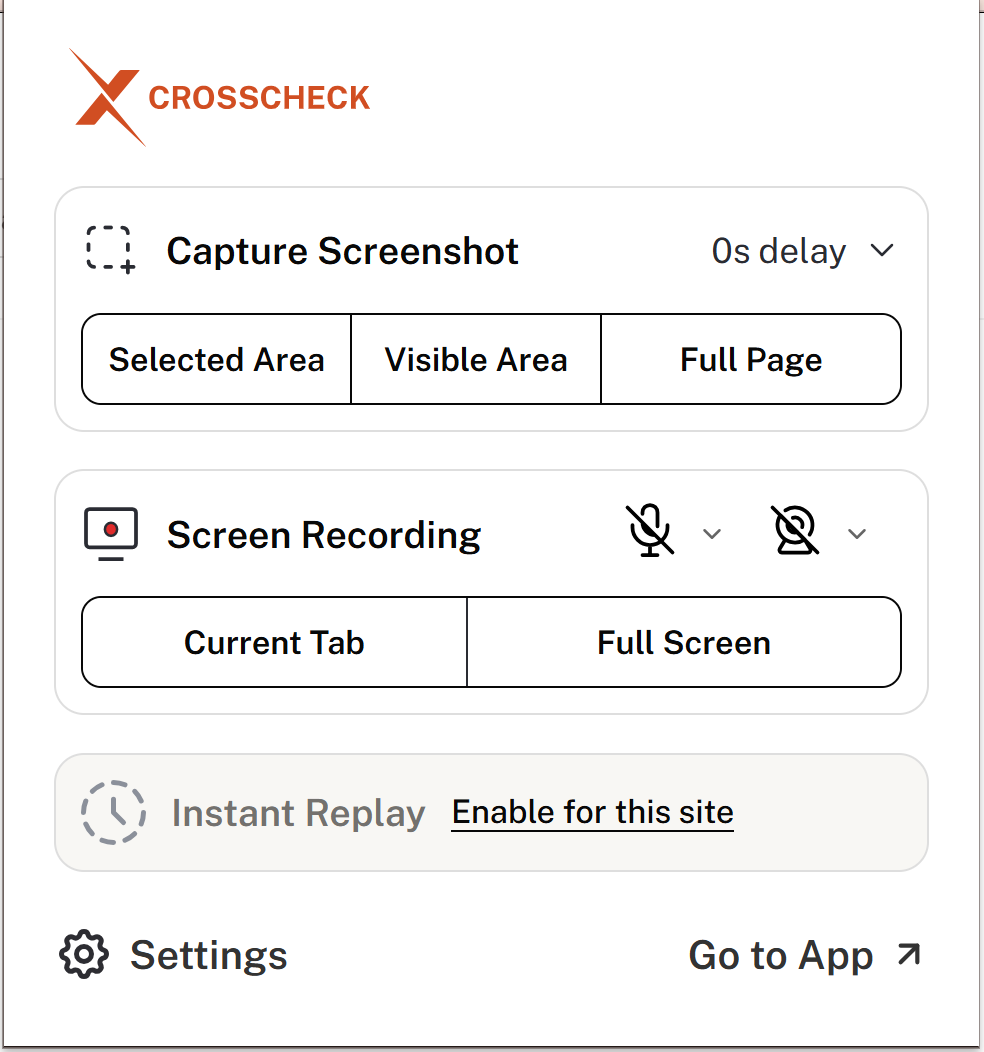
A quality culture lives or dies on the feedback loop. The closer the loop, the faster the team learns. Crosscheck is a free Chrome extension that closes the gap between "a user hit a bug" and "the developer has everything they need to fix it" — one-click capture of screenshot, screen recording, console logs, network requests, and browser metadata, sent to Jira, Linear, ClickUp, GitHub, or Slack. The teams running the rituals in this post use it to make sure every bug logged has the full context for a root cause document.