Load Testing vs Stress Testing: How They Differ and When to Run Each
Load testing and stress testing are both forms of performance testing, but they answer different questions. Load testing confirms a system performs acceptably under expected or peak traffic — the level you realistically anticipate. Stress testing deliberately pushes the system beyond that ceiling to find the breaking point and observe how it fails. The first is a confirmation exercise; the second is a discovery exercise. Skipping either leaves a gap in your release strategy.
Key takeaways
- Load testing validates that response times, throughput, and error rates stay within SLA under expected traffic — the baseline test before any meaningful release.
- Stress testing pushes load past maximum capacity to find where and how the system breaks, and whether it recovers.
- Beyond the two main types, modern performance suites typically also include soak, spike, endurance, and scalability tests — each tuned to a different failure pattern.
- k6 2.0 (Grafana Labs, released at GrafanaCON 2026) is the current default for code-first teams; JMeter still dominates enterprise stacks; Locust, Gatling, and Artillery each occupy clear niches.
- The metrics that decide a release are P95 / P99 response time, error rate by class (4xx vs 5xx), throughput plateau, and — for stress tests — recovery time.
What is load testing?
Load testing is a performance testing discipline that measures how an application behaves under expected or peak traffic. Before you run a load test, you define a target — concurrent users, requests per second, or transactions per minute that reflect realistic usage — and verify the system meets its service-level objectives at that load.
The output is a benchmark. Response times stay within agreed bounds. Error rates remain near zero. Throughput hits the target without saturating CPU, memory, or downstream services. If those conditions hold, the release passes the performance gate. If they don't, the test has surfaced an actionable bottleneck — a slow database query, a misconfigured connection pool, a memory leak under sustained traffic — that goes straight into the sprint.
Load tests are most useful when traffic shape is known: Black Friday for a retail platform, open-enrolment day for a healthcare portal, the launch window for a marketing campaign. Each has an estimable peak, and a load test gives a defensible answer to "can we serve this?" before the calendar forces the question.
What load testing reveals:
- Performance bottlenecks under realistic traffic
- Page-load regressions introduced by recent deployments
- Infrastructure ceilings before they become production incidents
- Whether autoscaling policies trigger at the right thresholds
What is stress testing?
Stress testing pushes an application beyond its normal operating capacity to identify the breaking point and characterise the failure. Load keeps climbing — past expected peak, past the documented maximum — until something gives. The system slows, errors spike, or a component fails outright. That moment is the data you came for.
A stress test succeeds when you learn something useful about failure. The system crashing is not a flaw — it's the test working as designed. The questions that matter: which component fails first, does the failure cascade to other services, are in-flight transactions preserved, and how quickly does the platform return to baseline once load subsides?
Teams that only load-test are repeatedly blindsided by the same pattern. The system handles the predicted peak, ships confidently, then collapses the first time a viral promotion or a misbehaving client pushes traffic two or three times higher than the projection. Stress testing is the cheap insurance against that scenario.
What stress testing reveals:
- The saturation threshold of the system
- Which dependency fails first — database, API gateway, cache, CDN, or load balancer
- Whether the system self-heals after the surge or requires manual intervention
- Data integrity under resource exhaustion — are records lost, duplicated, or corrupted?
- Whether failure is graceful (degraded mode, queued requests) or catastrophic (full outage)
Load testing vs stress testing at a glance
| Dimension | Load testing | Stress testing |
|---|---|---|
| Core question | Does the system perform acceptably under expected traffic? | Where and how does the system break? |
| Load applied | Expected or peak usage | Beyond maximum documented capacity |
| Test ends when | Target load is verified or SLA is violated | System fails or degrades significantly |
| Success looks like | All SLAs met, error rate near zero | Breaking point identified and characterised |
| Primary output | Performance benchmarks, regression deltas | Failure modes and recovery behaviour |
| When to run | Before releases, regularly, in CI/CD | Before major launches, after architecture changes |
| Risk appetite | Low — system is expected to stay stable | High — system is expected to fail |
| Frequency | Every meaningful release | Quarterly or pre-launch |
The simplest mental model: load testing confirms normal operation, stress testing investigates failure. Both are essential, and neither replaces the other.
The wider family: soak, spike, endurance, and scalability testing
Load and stress are the headliners, but a complete performance strategy uses at least three more shapes. Each isolates a different failure pattern.
Soak testing (also called endurance testing) holds expected load steady for an extended duration — four hours to several days. Soak tests catch the failures that only emerge over time: memory leaks, connection pool exhaustion, log file growth, slow-leaking session stores. A system that passes a 30-minute load test can still die at hour 18.
Spike testing simulates an instantaneous surge — traffic jumping from baseline to several multiples in seconds. Real triggers include viral content, a competitor outage, a TV mention, or a misconfigured client retry storm. Spike testing reveals whether autoscaling responds fast enough and whether queues absorb the burst gracefully.
Scalability testing is incremental rather than constant. Load steps up in defined increments — 1,000 users, then 2,000, then 5,000, then 10,000 — and the team watches how throughput, latency, and infrastructure cost respond at each step. The output is the system's scaling curve, which feeds capacity planning and unit-economics conversations.
These aren't separate disciplines so much as differently shaped runs of the same toolkit. A modern performance harness — whether k6, JMeter, or Gatling — can script any of them by changing the virtual-user ramp profile.
When to run a load test
Load testing belongs in the regular release cadence, not the pre-launch panic. Run one when:
- Before a meaningful release — any deployment touching a critical user flow (checkout, authentication, search, dashboard) deserves a load test against current traffic projections.
- After performance fixes — to verify the fix actually resolved the bottleneck and didn't shift it to a different layer.
- Before known high-traffic windows — Black Friday, fiscal year-end, product launches, marketing campaigns.
- When swapping infrastructure — moving cloud providers, changing database engines, adopting a new edge platform.
- As a CI gate — automated load tests with pass/fail thresholds catch performance regressions before they reach production. Both k6 and Locust expose first-class CI integrations that fail the pipeline when thresholds are breached.
A 12-person engineering team at a Series B SaaS that runs a weekly load test against staging will catch regressions weeks earlier than the same team relying on production alerting alone. That lead time is the entire point.
When to run a stress test
Stress testing is heavier than load testing and shouldn't run on every commit. It's most valuable in specific situations:
- Before major launches — when the cost of an outage justifies a day on simulated failure.
- For capacity and autoscaling planning — stress tests produce the concrete numbers infrastructure teams need: "connection pool saturates at 8,000 concurrent users, scale-out trigger should fire at 6,500."
- After architectural changes — splitting a monolith into services, adding a message queue, introducing a caching layer, or changing the database all create new failure surfaces.
- For disaster and resilience drills — simulating a downstream service outage, a database node failure, or a DDoS-shaped traffic surge.
- For security validation — certain denial-of-service patterns only become visible at resource exhaustion.
Performance testing tools developers actually use in 2026
The performance testing tool market has consolidated around four or five players. Each has a sharp profile.
k6 (Grafana Labs)
k6 has become the default for code-first teams. Scripts are written in JavaScript or TypeScript, the Go-based runtime runs tens of thousands of virtual users from a single machine, and it integrates natively with Grafana, Prometheus, and most CI/CD pipelines.
Grafana Labs released k6 2.0 at GrafanaCON 2026, reshaping the tool around AI-assisted testing. The new k6 x agent command bootstraps agentic testing workflows inside AI coding assistants like Claude Code, Codex, and Cursor — generating test scripts from natural-language prompts and project context. The release also ships a Playwright-inspired expect() assertions API, a consolidated extensions catalogue, and OpenTelemetry exporter improvements. TypeScript support — added in k6 1.0 — is now native, with no Webpack or Babel setup required.
Best for: cloud-native teams, DevOps-heavy workflows, modern API and browser testing, teams already on the Grafana observability stack.
Apache JMeter
Apache JMeter is the most widely deployed open-source performance tool, with over two decades of community support and more than 1,000 plugins. The current 5.6.x line requires Java 17, ships a full-featured Test IDE for recording and building test plans, and supports more protocols than any competitor — HTTP, FTP, JDBC, JMS, SOAP, LDAP, TCP, OS process, and dozens more via plugins.
JMeter's GUI test builder lowers the barrier to entry, which is why it remains the dominant tool in enterprise QA. The trade-off is resource consumption. JMeter is JVM-based and can become memory-intensive at scale — large test plans typically require either distributed mode across several injection servers or a managed service like BlazeMeter to generate serious load.
Best for: enterprise stacks, teams that need broad protocol coverage, QA professionals who prefer a GUI workflow, organisations with existing JMeter investment.
Locust
Locust writes load tests in plain Python. The latest release (May 2026) supports Python 3.10 through 3.14, and the event-based gevent runtime makes it efficient at high concurrency from a single process. Distributed mode scales horizontally across multiple machines.
Headless mode with pass/fail thresholds — settable via the @events.quitting.add_listener hook — slots naturally into GitHub Actions and GitLab CI. Microsoft ships a VS Code extension that uses Copilot to scaffold Locust tests, and Azure Load Testing accepts Locust scripts as a managed service.
Best for: Python-first teams, ML and AI service load testing (FastAPI + LLM endpoints in particular), teams that want tests in regular code rather than XML or a DSL.
Gatling
Gatling uses a non-blocking, asynchronous architecture written in Scala. The result is excellent per-agent throughput — typically more simulated users per machine than JMeter or Locust. Tests can be written in Scala, Java, or Kotlin since the Java API arrived in Gatling 3.7, and the built-in HTML reports are among the most detailed in the ecosystem.
The 2026 release of Gatling Studio, a free standalone desktop app, removes the longstanding criticism that Gatling was inaccessible without Scala fluency. Studio records browser sessions directly and exports Java + Maven projects, with additional language targets planned. Gatling Enterprise adds distributed cloud execution and live dashboards.
Best for: high-throughput scenarios, JVM-first organisations, teams that value detailed HTML reports.
Artillery
Artillery takes a YAML-first approach. Test scenarios are defined in configuration files, with optional JavaScript hooks for dynamic behaviour. It's lightweight, fast to set up, and particularly well-suited for REST, GraphQL, and WebSocket testing. Artillery's Lambda-based distributed execution lets teams burst to large virtual-user counts without standing up their own injection fleet.
Best for: API-focused teams, JavaScript and Node.js shops, microservices testing, scenarios where quick scriptable runs beat heavy GUI workflows.
The metrics that actually matter
Running the test is the easy half. Knowing which numbers tell the truth — and which mislead — separates a useful performance practice from theatre.
Response time percentiles
Average response time is a misleading metric on its own. A system with a 200ms average can still deliver 4-second responses to a meaningful slice of users. Always track percentiles: P50 (median, typical user experience), P90, P95 (the standard SLA target), and P99 for critical paths like checkout and login. For high-volume systems, track P99.9 — at one million requests a day, P99.9 still represents 1,000 users a day getting degraded service.
Throughput
Measured in requests per second (RPS) or transactions per second (TPS). Throughput tells you how much work the system is actually completing — not how much it's being asked to do. Throughput that plateaus or drops while offered load continues to climb is the clearest signal that the system is saturating.
Error rate by class
During a load test, error rate above 1% typically indicates a problem worth investigating. During a stress test, rising error rate is the headline signal that you're approaching or past the breaking point. Track 4xx and 5xx separately — they tell different stories. A surge in 5xx means the server is failing; a surge in 4xx may mean clients are misbehaving, or that authentication or rate-limiting is hitting unexpected paths.
Resource utilisation
CPU, memory, disk I/O, and network throughput on each infrastructure tier. Every meaningful performance bottleneck has a corresponding resource saturation somewhere in the stack. Finding the correlation between a latency spike and a CPU pegged at 100% is what turns a performance graph into a concrete fix.
Recovery time (stress-specific)
After the extreme load subsides, how long does the system take to return to baseline? Fast recovery indicates resilience; slow recovery, or no recovery without a restart, indicates a problem with resource management, queue draining, or memory handling. This is the metric most often missed in stress testing, and the one that matters most for on-call confidence.
A worked example: e-commerce, SaaS, and microservices
The same vocabulary applies very differently across product shapes.
A retail e-commerce platform with historical data showing 20,000 concurrent users at Black Friday peak runs its load test at that level — response times under 1.5 seconds, error rate below 0.1%, checkout completes. The team then runs a stress test to 80,000 users, modelling what a viral TikTok promotion could do. The payment gateway integration bottlenecks at 35,000, and the session store exhausts memory at 50,000. Two fixes — connection pooling on the gateway, Redis-backed sessions — ship before launch, with documented thresholds for the autoscaler.
A SaaS company launching a real-time collaboration feature models adoption at 5,000 weekly users with a peak of 500 concurrent. The load test confirms it. The stress test reveals WebSocket connections degrading at 1,200 concurrent users. The fix is a fallback to long-polling with a connection cap — graceful degradation rather than silent failure.
An internal API serving ten downstream services handles its baseline load comfortably. A stress test simulating all ten services spiking simultaneously — a real scenario during nightly batch processing — exposes an over-aggressive rate limiter rejecting legitimate requests. The fix is a configuration change, identified before the next batch window rather than during it.
Capturing the performance bugs that show up in manual testing
Load and stress tests catch the systemic patterns. They don't catch the dashboard that takes seven seconds to load for one specific user, the API call that hangs intermittently on staging, or the UI freeze that only happens after a particular sequence of clicks. Those bugs surface during manual exploratory testing — and they need to be filed with enough context that an engineer can fix them without a back-and-forth thread.
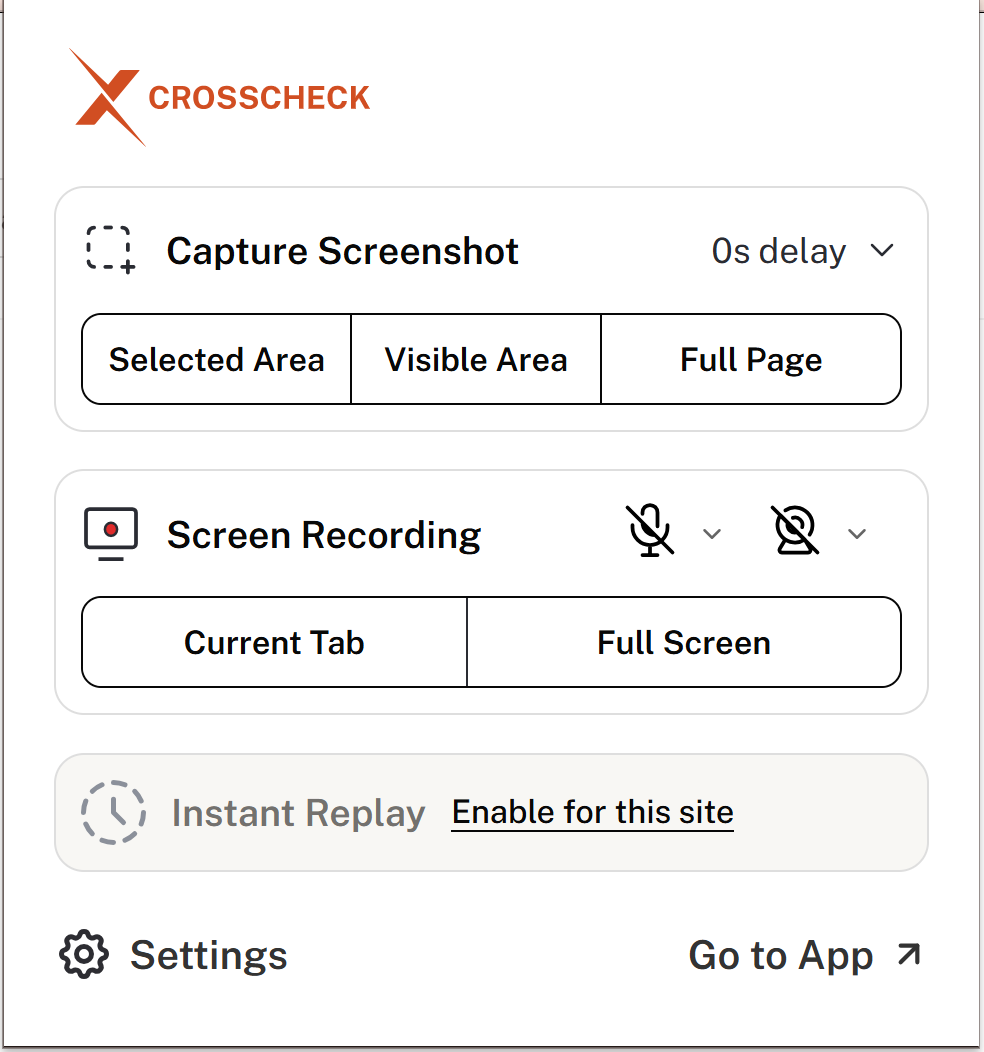
This is the gap Crosscheck is built for. The free Chrome extension captures performance context alongside every bug report: console logs at the moment of the issue, network request timings (every API call, its duration, status code, and payload), the user-action sequence that reproduced the behaviour, and page-load metrics — all attached automatically to the ticket, alongside a structured bug report format the receiving engineer can act on immediately. The report ships directly into Jira, Linear, ClickUp, GitHub, or Slack with one click.
It's not a replacement for k6, JMeter, or Gatling. It's the layer that closes the loop between automated performance testing and the real-world performance bugs that humans notice first. For teams already running a modern test automation stack, Crosscheck is the reporting layer that makes those findings actionable in seconds.
Building a complete performance testing strategy
Load and stress are complementary, not alternatives. A defensible strategy uses both, plus at least one of the wider patterns.
- Establish a baseline with load tests against current expected traffic. Those numbers become the benchmark every future change is measured against.
- Automate load tests in CI/CD with explicit thresholds — P95 latency, error rate, throughput — that fail the pipeline when regressions exceed tolerance. k6 and Locust both expose first-class CI integrations.
- Run stress tests before major releases and after meaningful architecture changes. Document the breaking points and feed them to the autoscaler configuration.
- Add soak tests for long-running services. A 30-minute load test will not surface the memory leak that kills the system at hour 14.
- Combine automated testing with exploratory walkthroughs. Tools like k6 handle the systematic volume; tools like Crosscheck capture the anomalies that emerge during real-usage testing.
The teams that treat performance as a continuous practice — rather than a pre-launch checklist — are the ones that avoid the incidents that make trade-press headlines. Load and stress testing are the foundation of that practice. Soak, spike, and scalability extend the same foundation to different failure modes.
FAQ
Is stress testing the same as load testing?
No. Load testing measures system behaviour under expected or peak traffic and verifies SLA compliance. Stress testing pushes load beyond the documented maximum to find the breaking point and characterise the failure. Both are forms of performance testing, but they answer different questions.
What are the main types of performance testing?
The main types are load, stress, soak (endurance), spike, and scalability testing. Load and stress are the headliners. Soak holds steady load over hours or days to catch slow leaks. Spike simulates instantaneous surges. Scalability steps load up in increments to chart the system's scaling curve.
Which tool should I use for load testing in 2026?
k6 2.0 is the most common default for new projects — JavaScript and TypeScript scripts, lightweight Go runtime, native Grafana integration, AI-assisted test generation via k6 x agent. JMeter remains dominant in enterprise stacks, Locust is the natural choice for Python-first teams, and Gatling Studio has lowered the barrier for JVM organisations. Pick the tool that fits the languages your team already writes.
How long should a load test run for?
A standard load test runs 15 to 30 minutes at the target load with a 5 to 10 minute ramp-up — long enough for steady-state behaviour, short enough for a CI window. Soak tests, by contrast, run for 4 to 72 hours.
What's a good P95 response time?
For interactive web pages, P95 under 1.5 seconds is a common SLA target. For user-facing API calls, under 300ms is typical; for internal service-to-service calls, under 100ms. Checkout flows are stricter than analytics dashboards.
Start filing better performance bug reports
Load and stress testing tell you how the system performs at scale. They don't catch the slow page, the hanging request, or the UI freeze that surfaces during manual testing — and they don't help your team file those bugs with enough context to fix them quickly.
Crosscheck is the free Chrome extension that closes that loop. Every bug report ships with console logs, network timings, user-action sequences, and performance metrics already attached — filed directly into Jira, Linear, ClickUp, GitHub, or Slack with one click. No setup, no paid tier.