Check Detail View
Opening any check from the dashboard takes you into the detail view. This is where you review the captured media alongside the metadata and developer context that was collected at the moment the check was created, and where you collaborate with teammates through comments and sharing.
Page Layout
The detail view is split into a few clear regions:
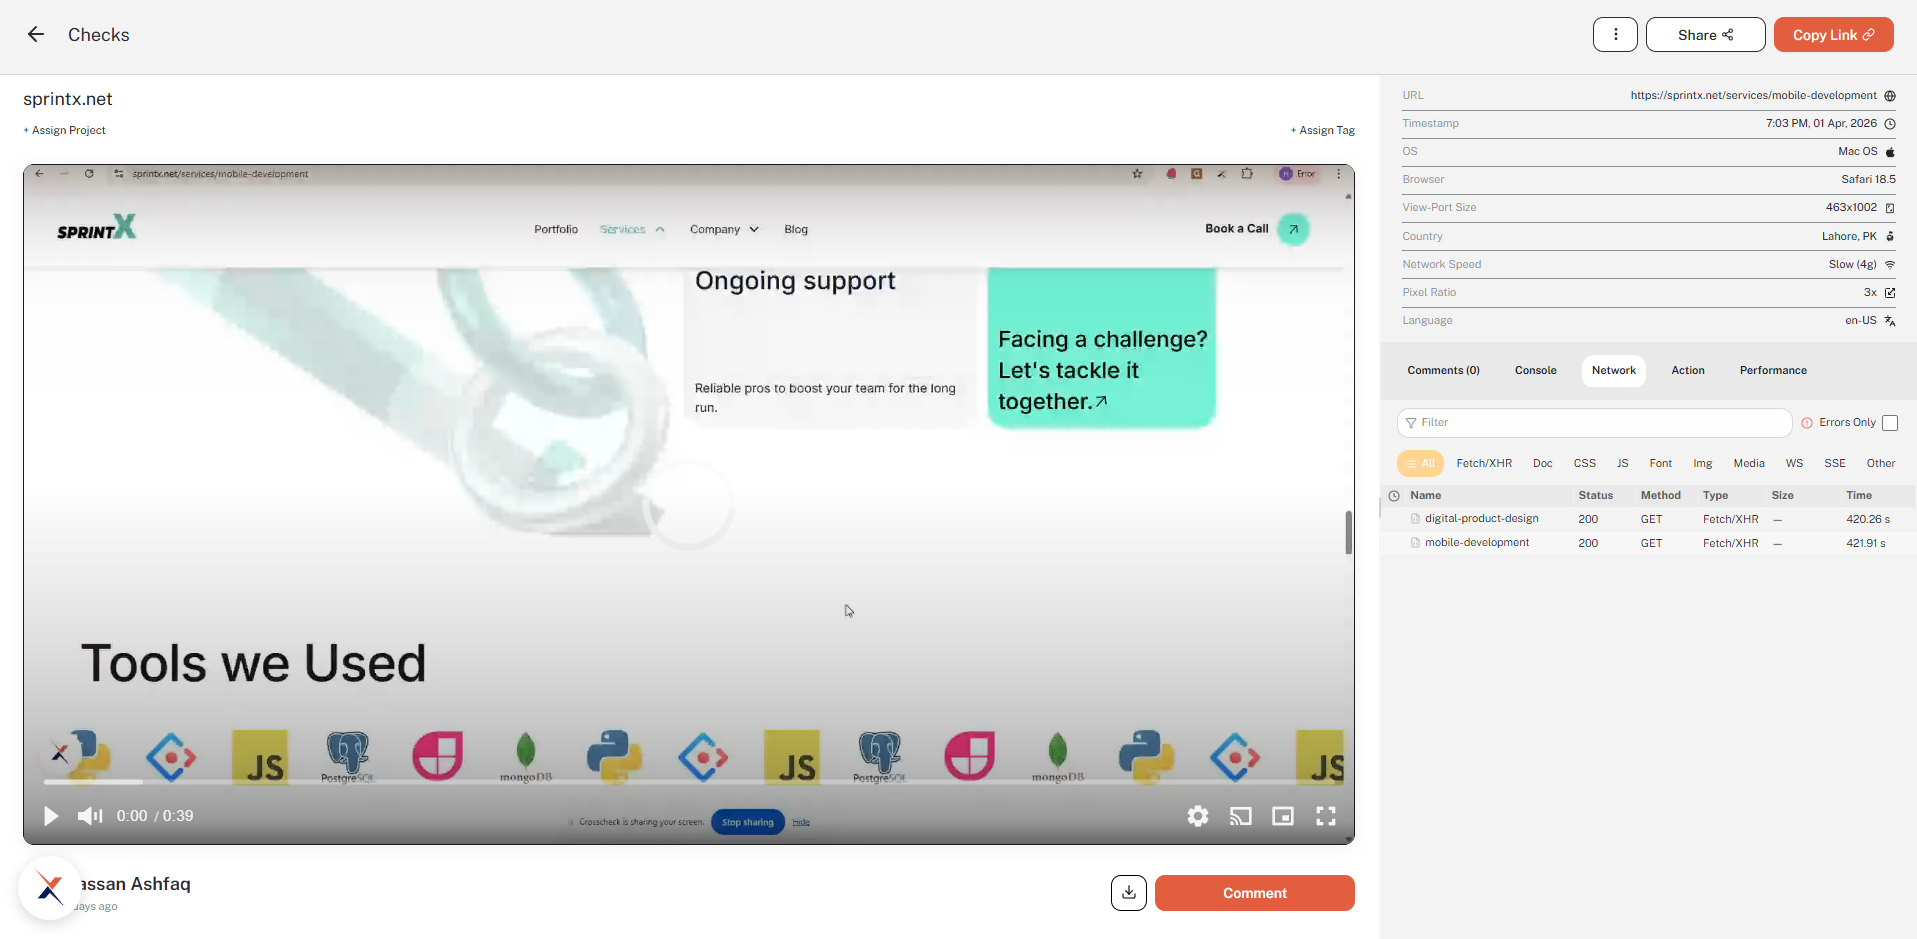
- Top bar — A back arrow to return to the checks list, the Checks label, and the collaboration controls (three-dot menu, Share, Copy Link) on the right.
- Title row — The captured page URL as the heading, with + Assign Project on the left and + Assign Tag on the right for quick organization.
- Media area (left) — The screenshot, screen recording, or instant replay with playback controls.
- Metadata sidebar (top right) — Environment details captured at the time of the check.
- DevTools tabs (bottom right) — Comments, Console, Network, Action, and Performance.
- Footer — The check author and timestamp on the left, and the download icon plus the Comment button on the right.
Check Media
The media section displays different content depending on the check type:
| Check Type | What You See |
|---|---|
| Screenshot | Full-resolution PNG with the captured page and any annotations baked in |
| Screen Recording | Video player with play / pause, mute, current time and duration, playback settings, picture-in-picture, and full screen |
| Instant Replay | Session replay player that reconstructs the recorded DOM — scrub the timeline to step through user interactions exactly as they happened |
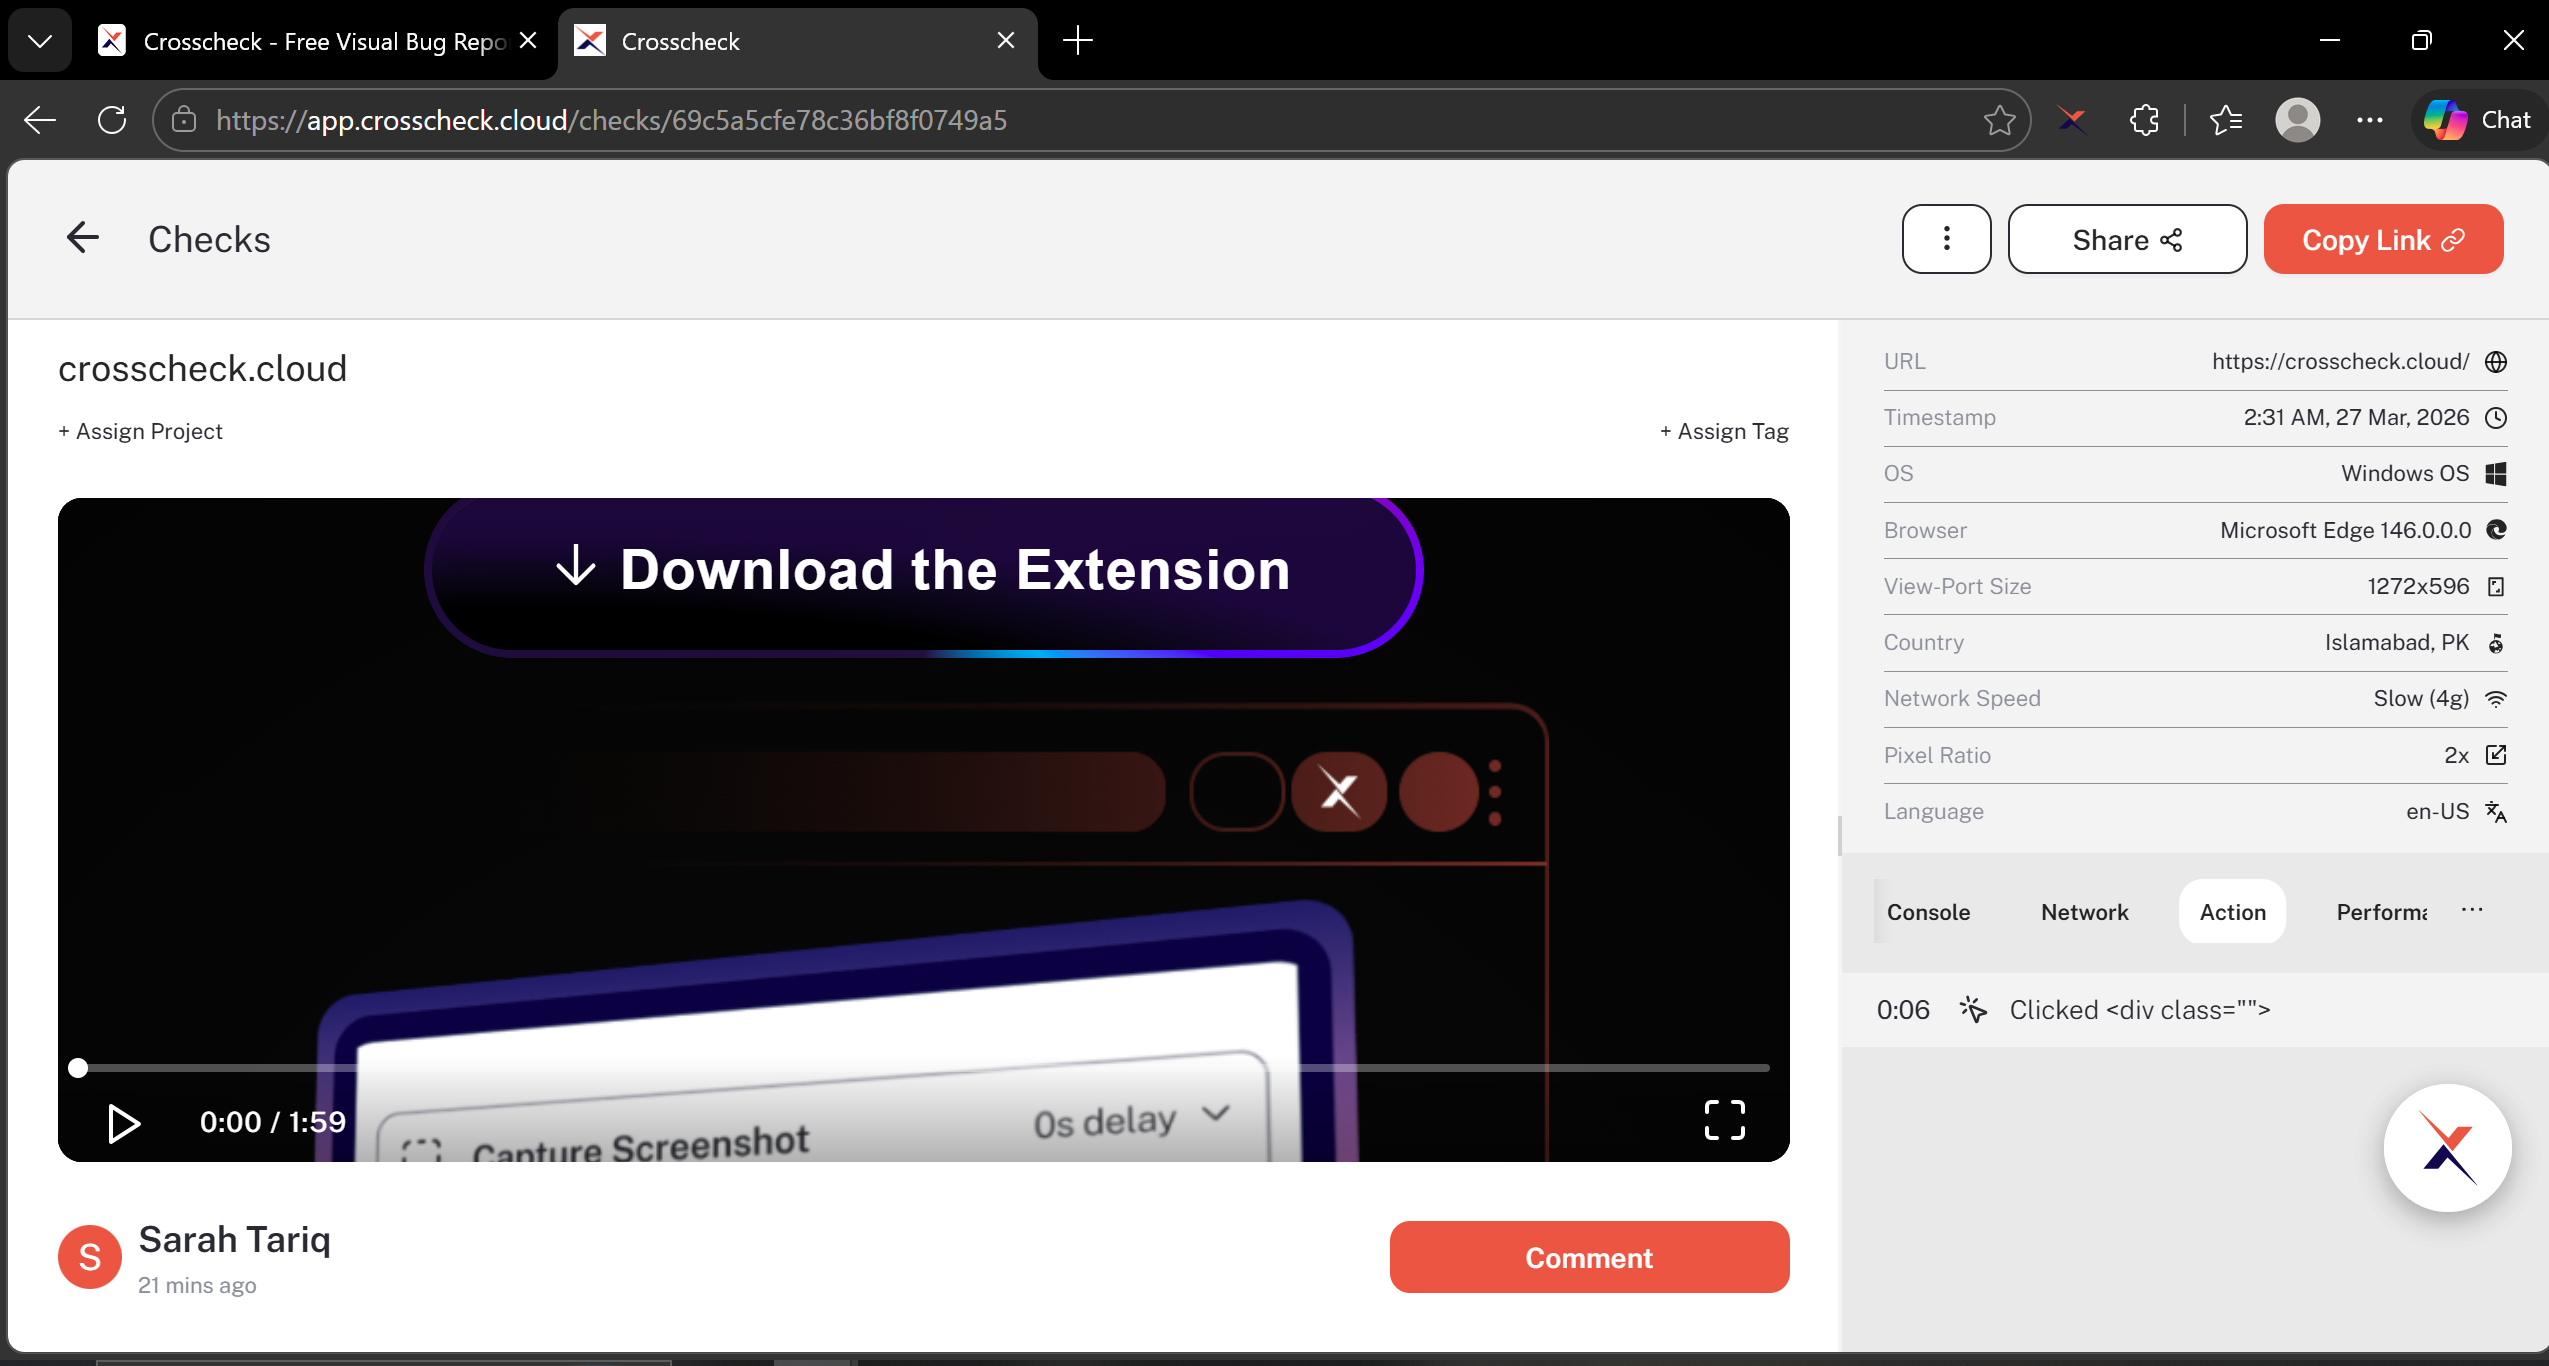
Metadata Sidebar
The top of the right column lists the environment details captured at the moment the check was created:
- URL — The full URL of the page that was being tested.
- Timestamp — Date and time when the check was created.
- OS and Browser — Operating system and browser version of the reporter.
- View-Port Size and Pixel Ratio — Window dimensions and device pixel ratio at capture time.
- Country, Network Speed, and Language — Useful for reproducing locale and connectivity-specific issues.
DevTools Tabs
Below the metadata sidebar, a tabbed panel exposes everything captured alongside the media. Switch between tabs to focus on a single category of context.
Comments
The default tab when you open a check. Team members can leave threaded comments, ask questions, and discuss the check without leaving the dashboard. The tab label shows the current comment count (for example, Comments (0)).
Console
Browser console output captured during the session, with a search filter and quick toggles for All Messages, Errors, Warnings, Info, and Runtime. The header shows the total Issues count so you can see at a glance how many errors and warnings the check contains.
Network
All HTTP requests made during the check. The table shows Name, Status, Method, Type, Size, and Time for each request. Filter by resource type using the chips above the table — All, Fetch/XHR, Doc, CSS, JS, Font, Img, Media, WS, SSE, Other — or check Errors Only on the right to focus on failed requests.
Action
A chronological timeline of user interactions recorded during the session — clicks, key presses, typed text, and navigation events. Each entry is timestamped against the recording so you can trace exactly what the user did leading up to the bug.
Performance
Page load metrics for each navigation in the check. The table shows the request Name, TTFB (time to first byte), FCP (first contentful paint), and total Load time — useful for diagnosing slow initial renders.
Sharing and Collaboration
The top-right of the detail view exposes the collaboration controls:
Share
Click Share to open the Share this check dialog. From here you can:
- Invite by email — Type one or more comma-separated email addresses and click Invite.
- Copy link — Use the Copy link shortcut at the top of the dialog to grab a direct URL.
- Toggle visibility — Use the Private / Public switch under Who has access. Public links can be opened by anyone with the URL; private links require an explicit invite.
Copy Link
The orange Copy Link button next to Share copies the check URL to your clipboard with a single click — handy for pasting into Slack, a ticket, or a chat thread.
Three-dot menu
Click the ⋮ icon to the left of Share to open a small menu with two actions:
- Create Task — Push the check to a connected integration such as Jira, ClickUp, or Linear so the bug becomes an actionable ticket in your team's workflow.
- Delete — Permanently remove the check from the dashboard.
Comments and footer actions
Below the media area, the footer shows the check author with a relative timestamp on the left, and two actions on the right:
- Download icon — Save the captured media to your machine. Screenshots download as PNG and screen recordings / instant replays download as MP4.
- Comment button — Click to add a comment pinned to the current playback timestamp. The comment is then listed under the Comments tab with its time marker, so reviewers can jump straight to the moment in the recording it refers to.