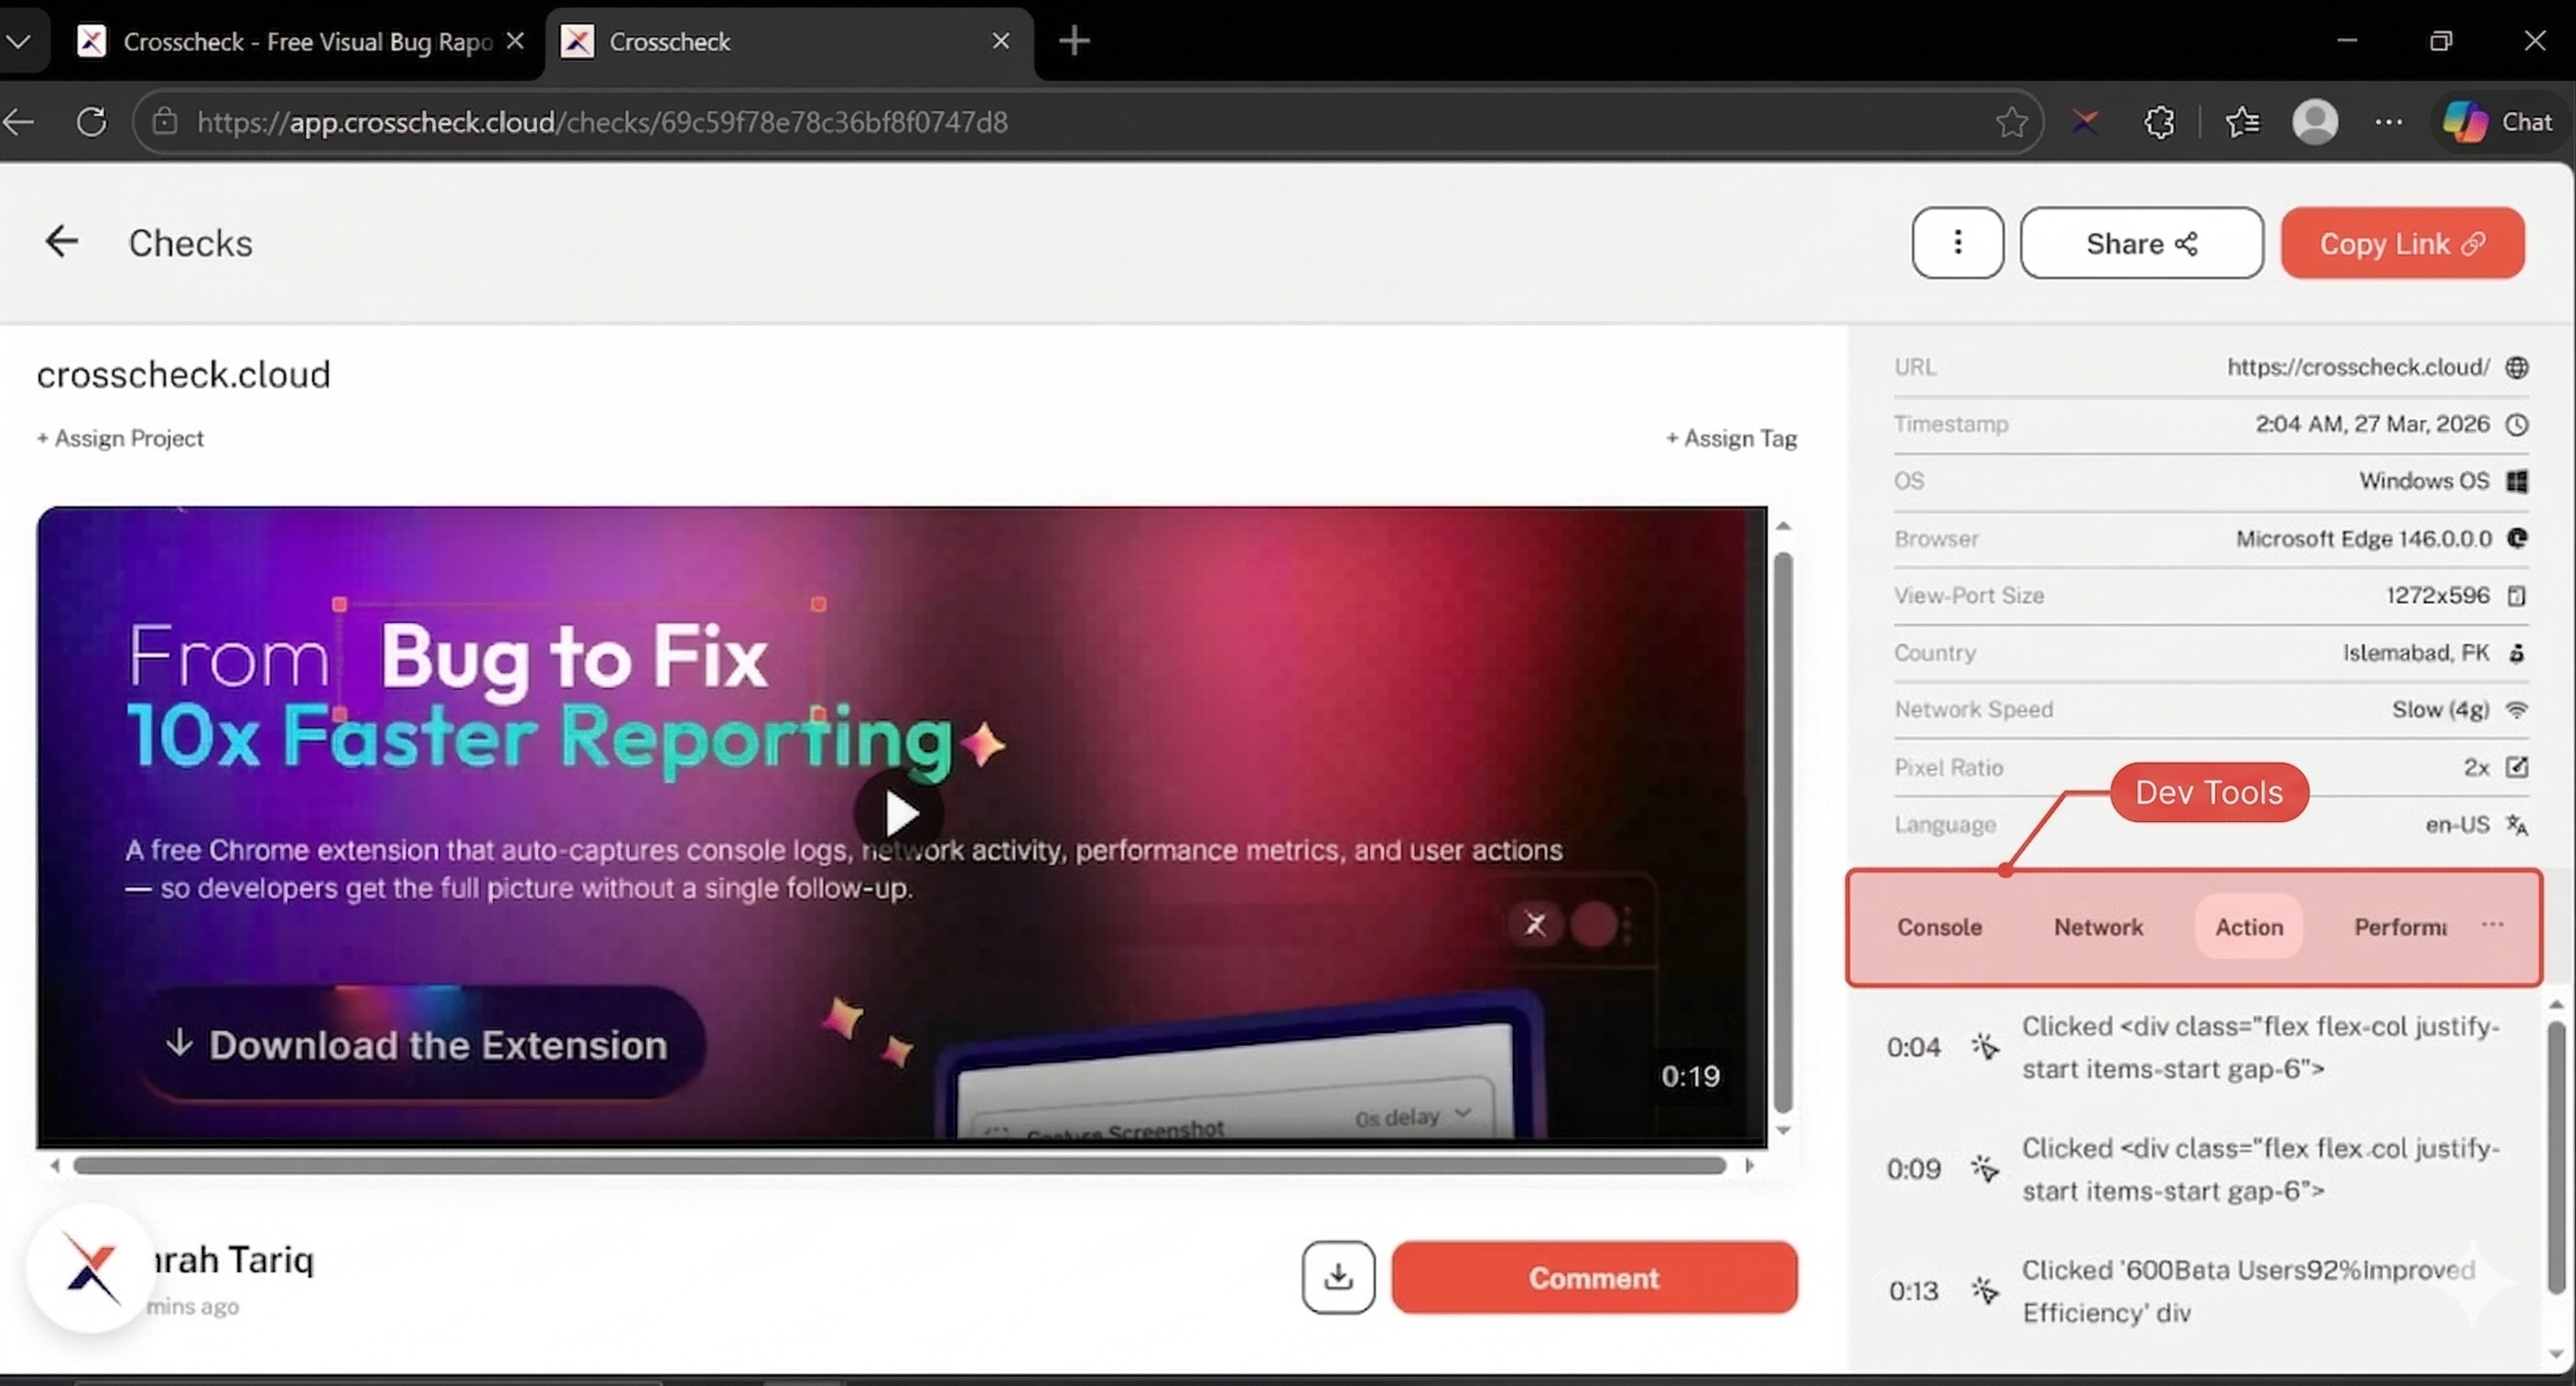
Developer Context (DevTools)
Every Crosscheck check automatically includes developer context alongside the visual evidence. When you take a screenshot, record your screen, or save an instant replay, Crosscheck collects console logs, network requests, and user actions from the page in the background. This turns every check into a self-contained bug report with the technical detail developers need to reproduce and fix issues.
What Gets Captured
Developer context is organized into four categories. Each category is viewable in its own tab on the check detail page.
All console output from the page including errors, warnings, info messages, and general log statements. Each entry shows the log level, message content, and timestamp.
Every HTTP request made by the page. Includes the URL, HTTP method, response status code, timing data, and request/response headers.
A timeline of user interactions on the page: clicks, double clicks, keypresses, and navigation events. Each action has a timestamp for correlation with the check.
Page performance metrics including TTFB, DOMContentLoaded, page load time, and First Contentful Paint. Helps identify performance-related issues alongside visual bugs.
Console Logs
Crosscheck intercepts all calls to the browser console API. The following log levels are captured and displayed with color-coded badges in the check detail view.
| Level | Description | Common Sources |
|---|---|---|
| Error | Runtime errors, uncaught exceptions, and failed assertions | JavaScript exceptions, failed API calls, React error boundaries |
| Warning | Deprecation notices, potential issues, and non-critical problems | Deprecated API usage, missing keys in React lists, CSP warnings |
| Info | General informational messages logged by the application | Application state changes, feature flags, user events |
| Log | General-purpose log output from the application | Variable dumps, state logging, function traces |
Filtering Console Logs
When reviewing captured console logs, you can filter by log level to focus on errors or warnings. The check detail view provides toggle buttons for each log level so you can quickly narrow down the relevant entries.
Network Requests
All XHR and Fetch requests made by the page are recorded, including requests that were initiated before the check. Each request entry contains the following data.
| Field | Description |
|---|---|
| URL | The full request URL including query parameters |
| Method | HTTP method (GET, POST, PUT, DELETE, PATCH, etc.) |
| Status Code | The HTTP response status code (200, 404, 500, etc.) |
| Timing | How long the request took from initiation to completion |
| Request Headers | Headers sent with the request (sensitive headers may be filtered) |
| Response Headers | Headers received in the response |
User Actions Timeline
The user action timeline tracks interactions on the page and presents them in chronological order. This helps developers understand exactly what the user did before and during the check.
| Action Type | Details Captured |
|---|---|
| Click | Element selector, coordinates, and the text content of the clicked element |
| Navigation | URL changes including pushState, replaceState, and full page navigations |
| Double Click | Element selector and coordinates of the double-clicked element |
| Keypress | Keyboard interactions on the page |
How Developer Context Capture Works
Understanding how devtools data flows from the page to your check.
Automatic activation
Continuous recording
Capture triggered
Upload and storage