Explore the Dashboard
The Crosscheck web dashboard at app.crosscheck.cloud is where your team reviews, organizes, and collaborates on checks. This guide walks through the main areas of the interface so you can find your way around.
Organize checks by project. Each project has its own checks list and ID numbering.
Browse all checks in a visual grid with thumbnail previews.
Full check view with video player, devtools panel, comments, and sharing.
Narrow down checks by type, date, tags, and more.
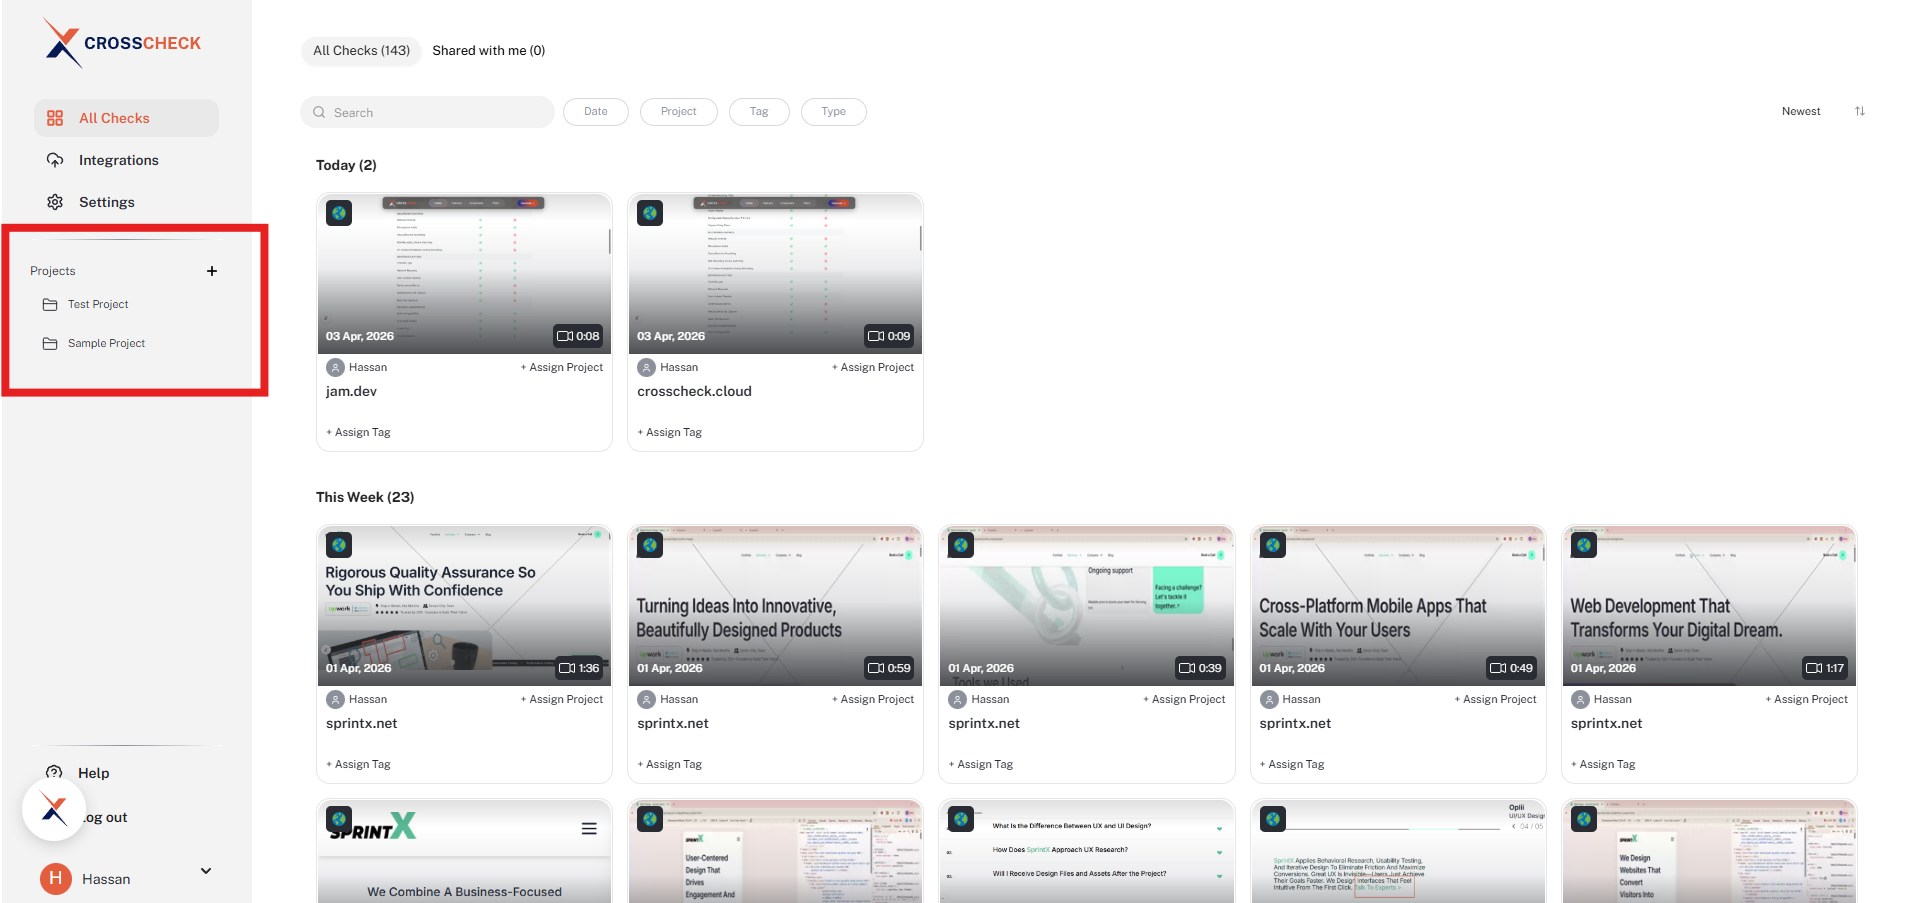
Projects
Projects are the top-level organizer for your checks. Each project belongs to a workspace and contains its own set of checks. Use projects to separate checks by application, feature area, or sprint.
The left sidebar lists all projects in your current workspace under the Projects section. Click a project name to view its checks, or use the + icon next to the "Projects" label to create a new one. Above the project list, All Checks shows every check across every project in the workspace, which is handy when you are not sure where a check lives.
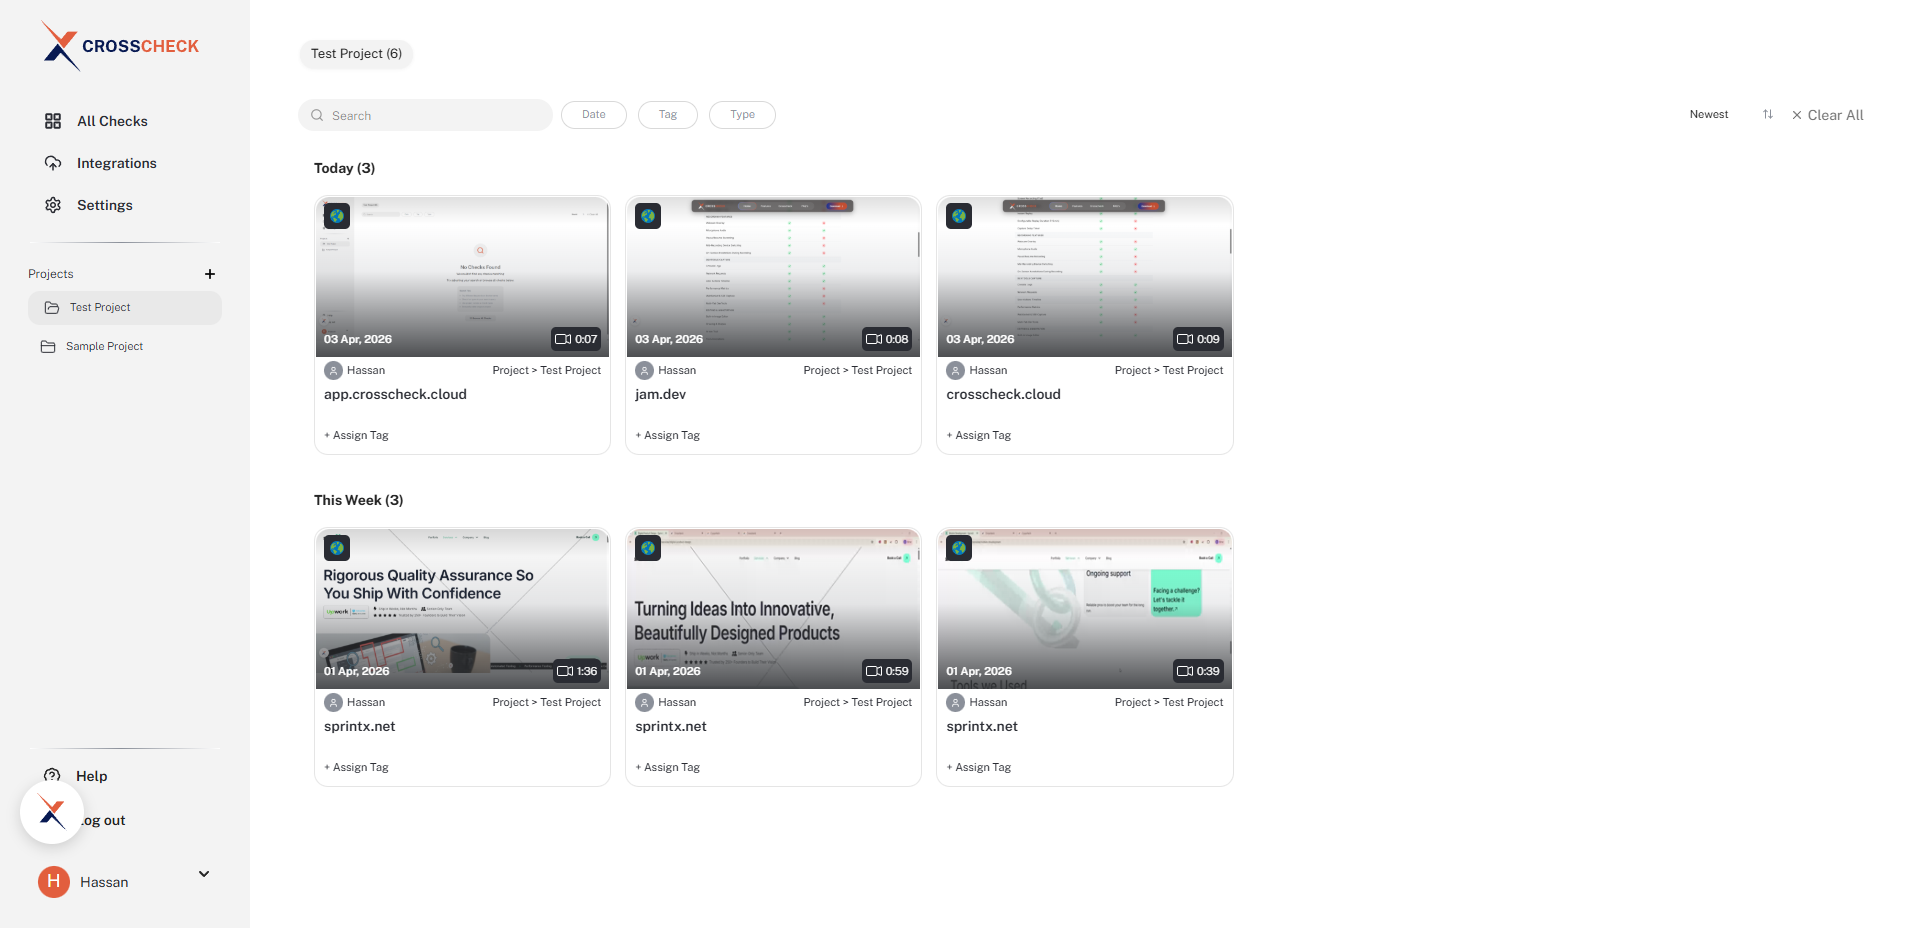
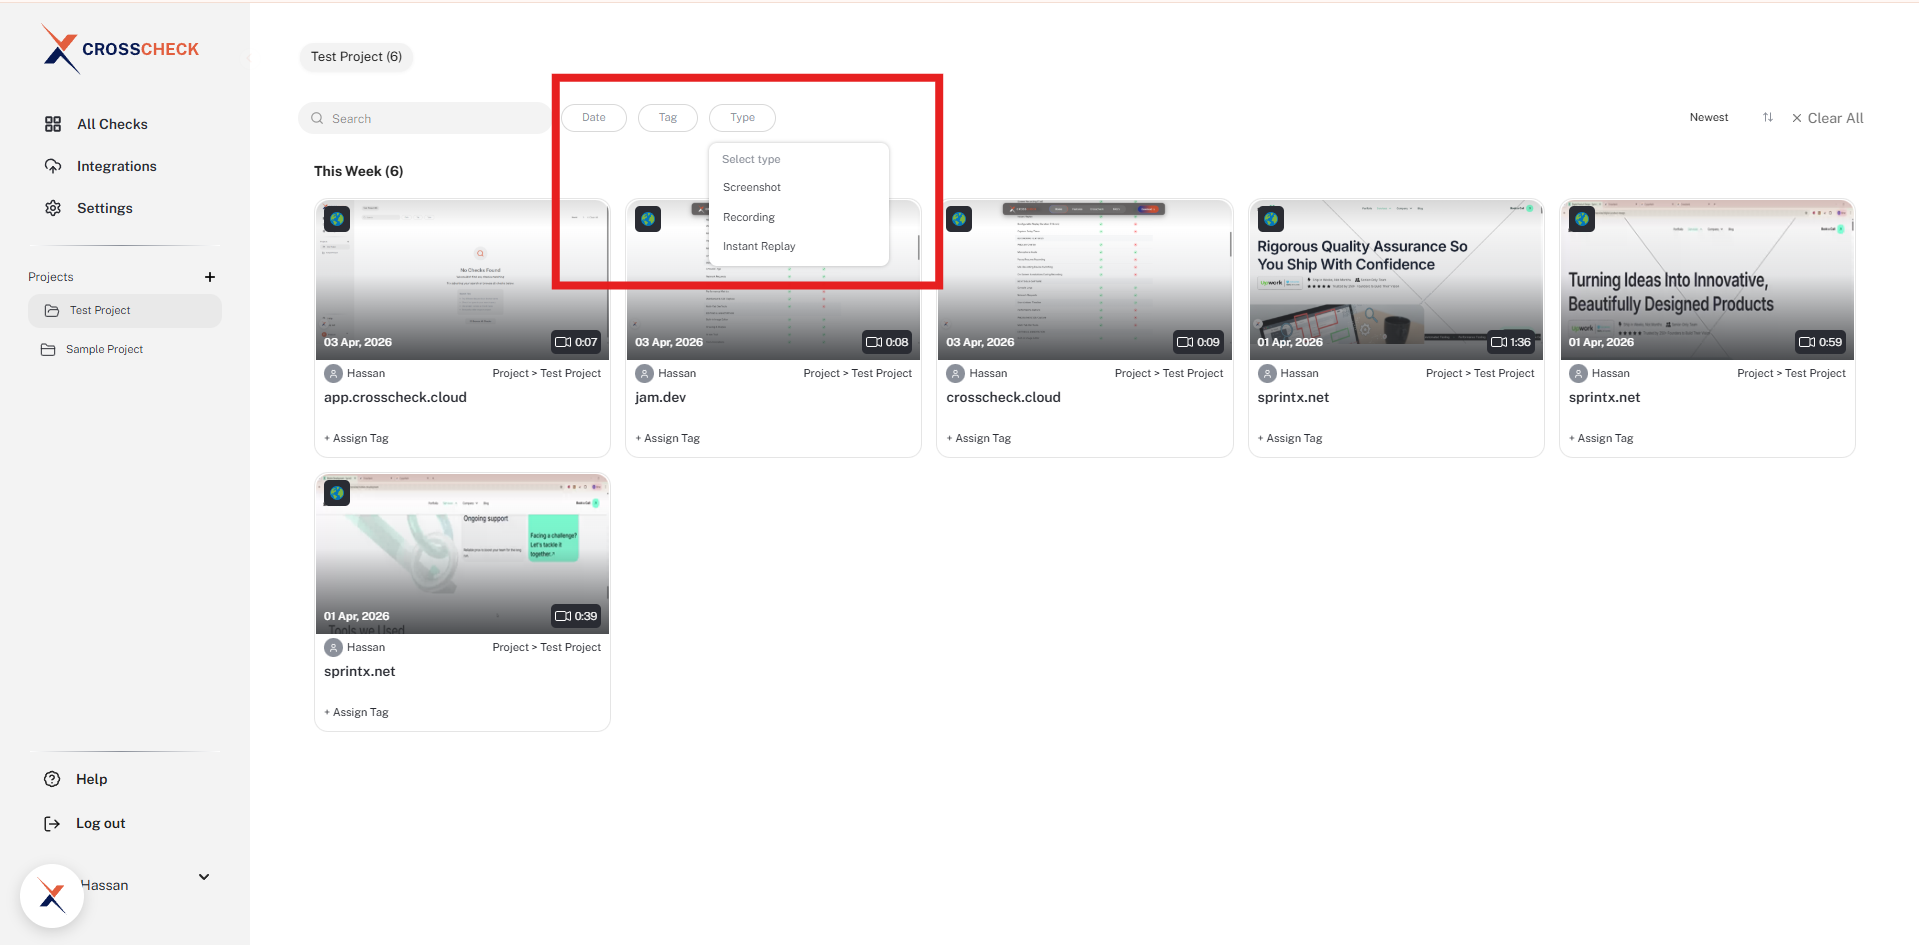
Checks grid
When you select a project, you see all of its checks displayed as visual cards with thumbnail previews, grouped by date (Today, This Week, and so on). Each card shows the captured page URL, the author, the project, the check date, and the duration for video and replay checks. A Search bar above the grid lets you find checks by URL or title, and the sort control on the right switches between newest and oldest first.
Check detail view
Click on any check to open its detail view. This is where you review the full check with all its context. The detail view is split into several areas:
Media player
The top section displays the check itself. Depending on the check type, this will be:
- An annotated screenshot image for screenshot checks.
- A video player with playback controls for screen recordings.
- An interactive session replay player for instant replay checks, where you can scrub through the timeline and see DOM changes as they happened.
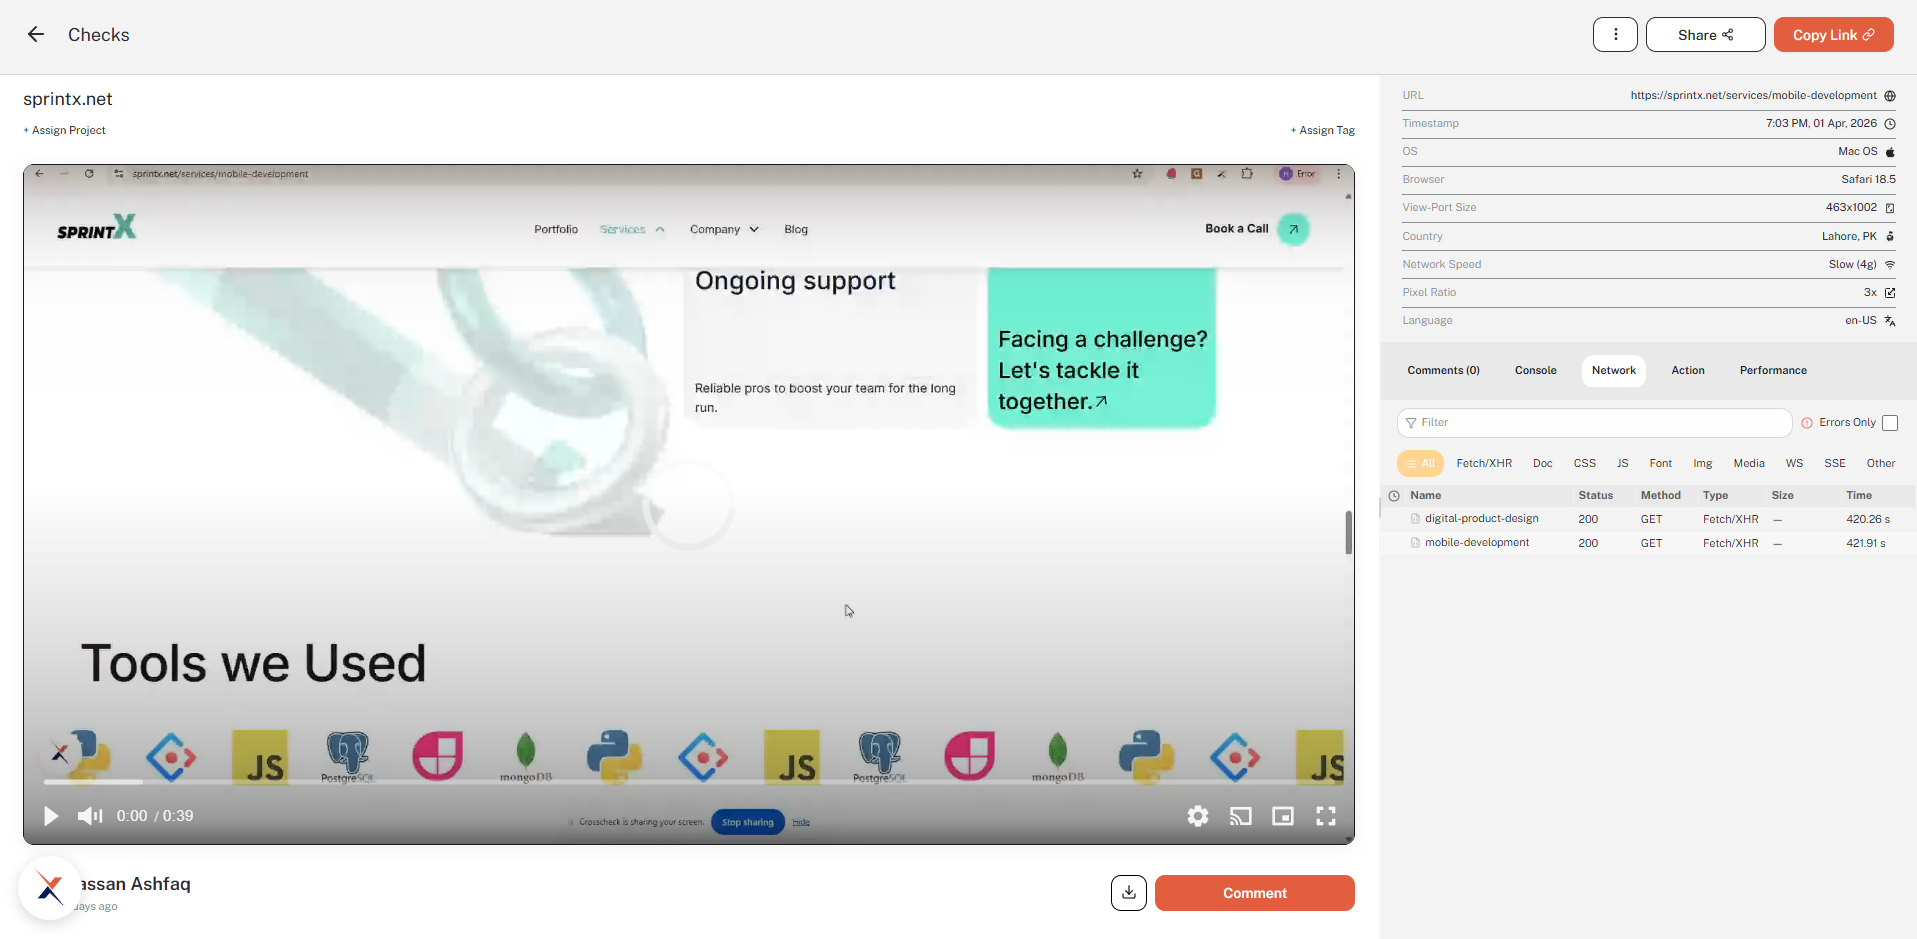
Developer context panel
To the right of the media player, a tabbed panel shows the developer context that was captured alongside the check. The tabs are Comments, Console, Network, Action, and Performance:
- Comments — Threaded discussion on the check. Team members can leave feedback, ask questions, or mark items as resolved without leaving the dashboard.
- Console — Browser console messages (errors, warnings, info, log) with timestamps. Errors and warnings are highlighted for quick identification.
- Network — HTTP requests made during the check, including URL, method, status code, response time, and payload size. Failed requests are flagged.
- Action — A chronological timeline of user interactions: clicks, keypresses, page navigations, and more. Each entry is timestamped against the recording so you can see exactly what the user did leading up to the bug.
- Performance — Page load timing and runtime performance metrics captured during the session, helping identify slow renders and resource bottlenecks.
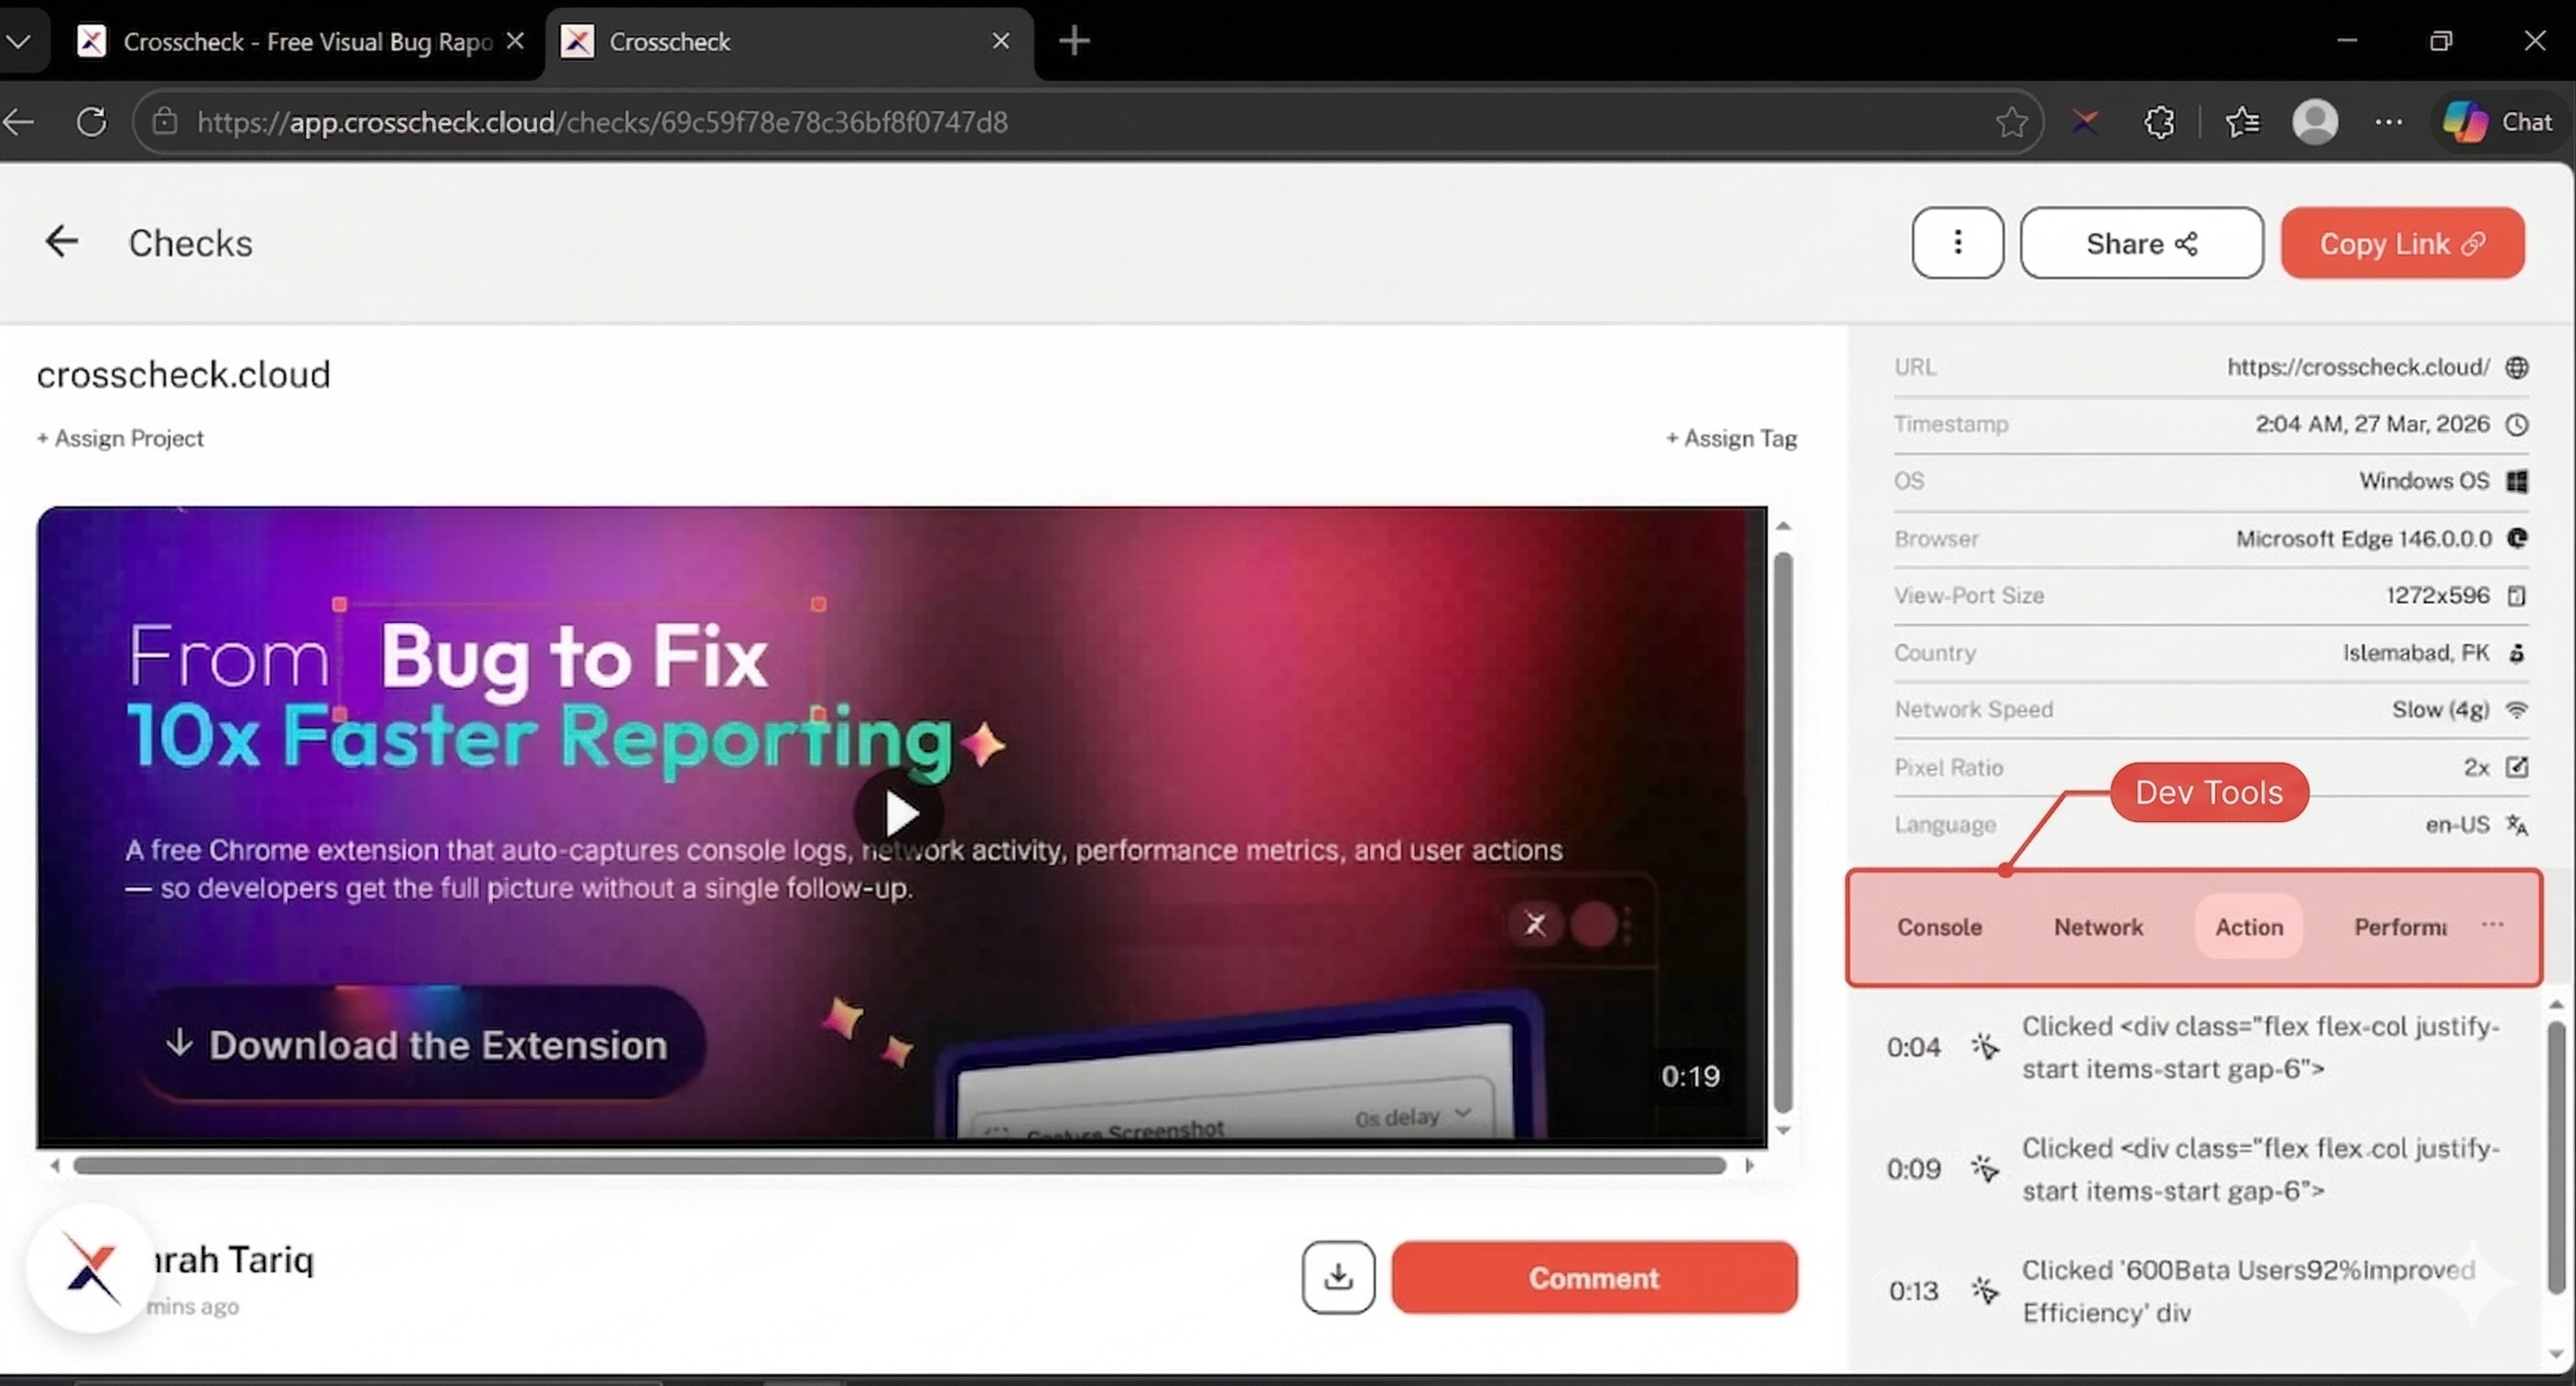
Metadata sidebar
Above the devtools panel, the metadata sidebar lists the environment details captured at the moment the check was created:
- URL — The page that was captured.
- Timestamp — Date and time of the check.
- OS and Browser — Operating system and browser version of the reporter.
- View-Port Size and Pixel Ratio — Window dimensions and device pixel ratio at capture time.
- Country, Network Speed, and Language — Useful for reproducing locale and connectivity-specific issues.
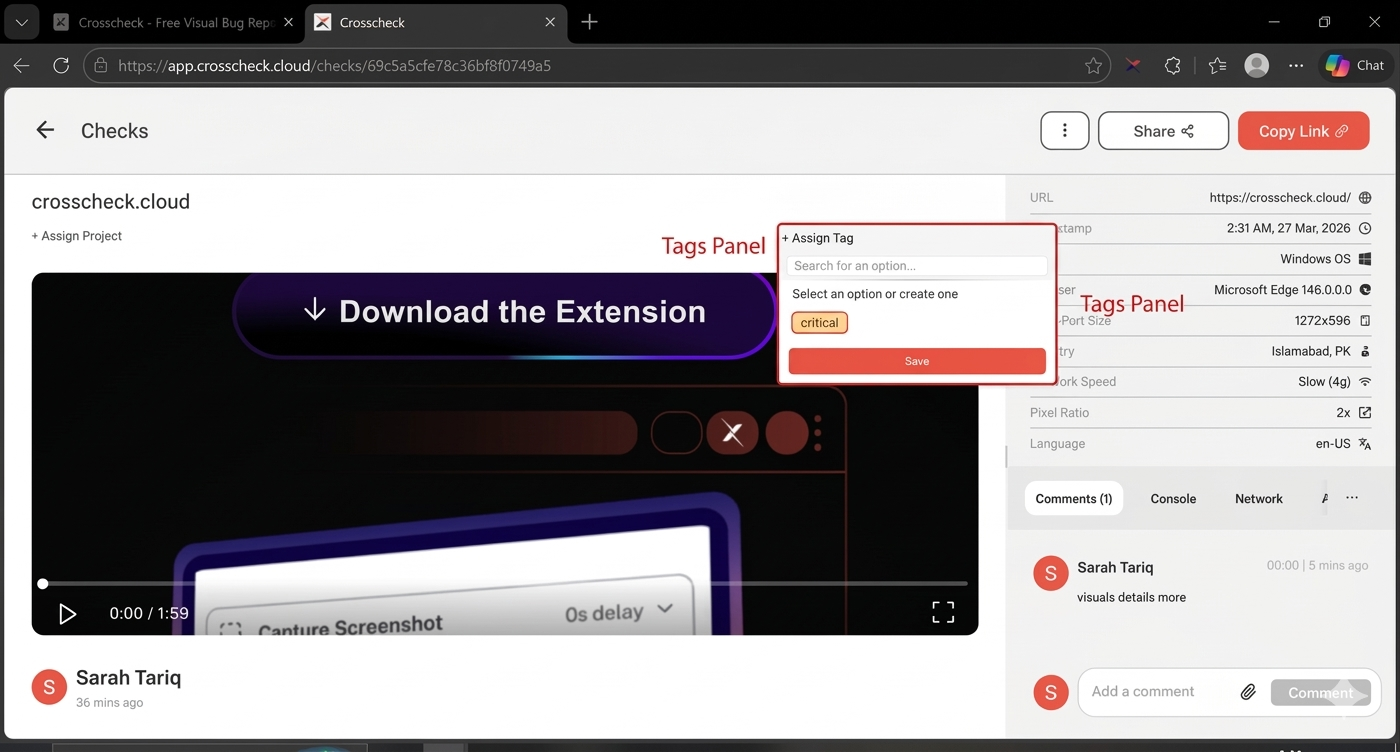
Above the title you can also use + Assign Project and + Assign Tag to move a check between projects or tag it from the detail view.
Sharing and collaboration
The top-right of the detail view has Share and Copy Link buttons for quick collaboration. Share opens a dialog where you can invite teammates by email, copy a direct link, and toggle the check between Private and Public access — public links can be opened by anyone with the URL, while private links require an invite.
Filtering checks
As your project grows, use the filter chips above the checks grid to narrow down the list. The filter bar sits next to the search box and offers three filters:
- Date — Filter checks created within a specific time period.
- Tag — Filter by one or more tags applied to checks.
- Type — Pick between Screenshot, Recording, or Instant Replay.
Filters can be combined with the search box. For example, you can view all recordings tagged "critical" from the past week. Use Clear All on the right side of the bar to reset every filter at once.
Tags
Tags are labels you can apply to checks for categorization. Common use cases include priority levels (critical, major, minor), feature areas (auth, payments, dashboard), or statuses (needs-review, confirmed, resolved).
Tags are defined at the workspace level, so all projects in a workspace share the same tag set. You can create and manage tags directly from the check detail view by clicking + Assign Tag, which opens the tags panel — search for an existing tag or create a new one inline. Apply multiple tags to a single check to cross-reference it across categories.