Reading DevTools Data
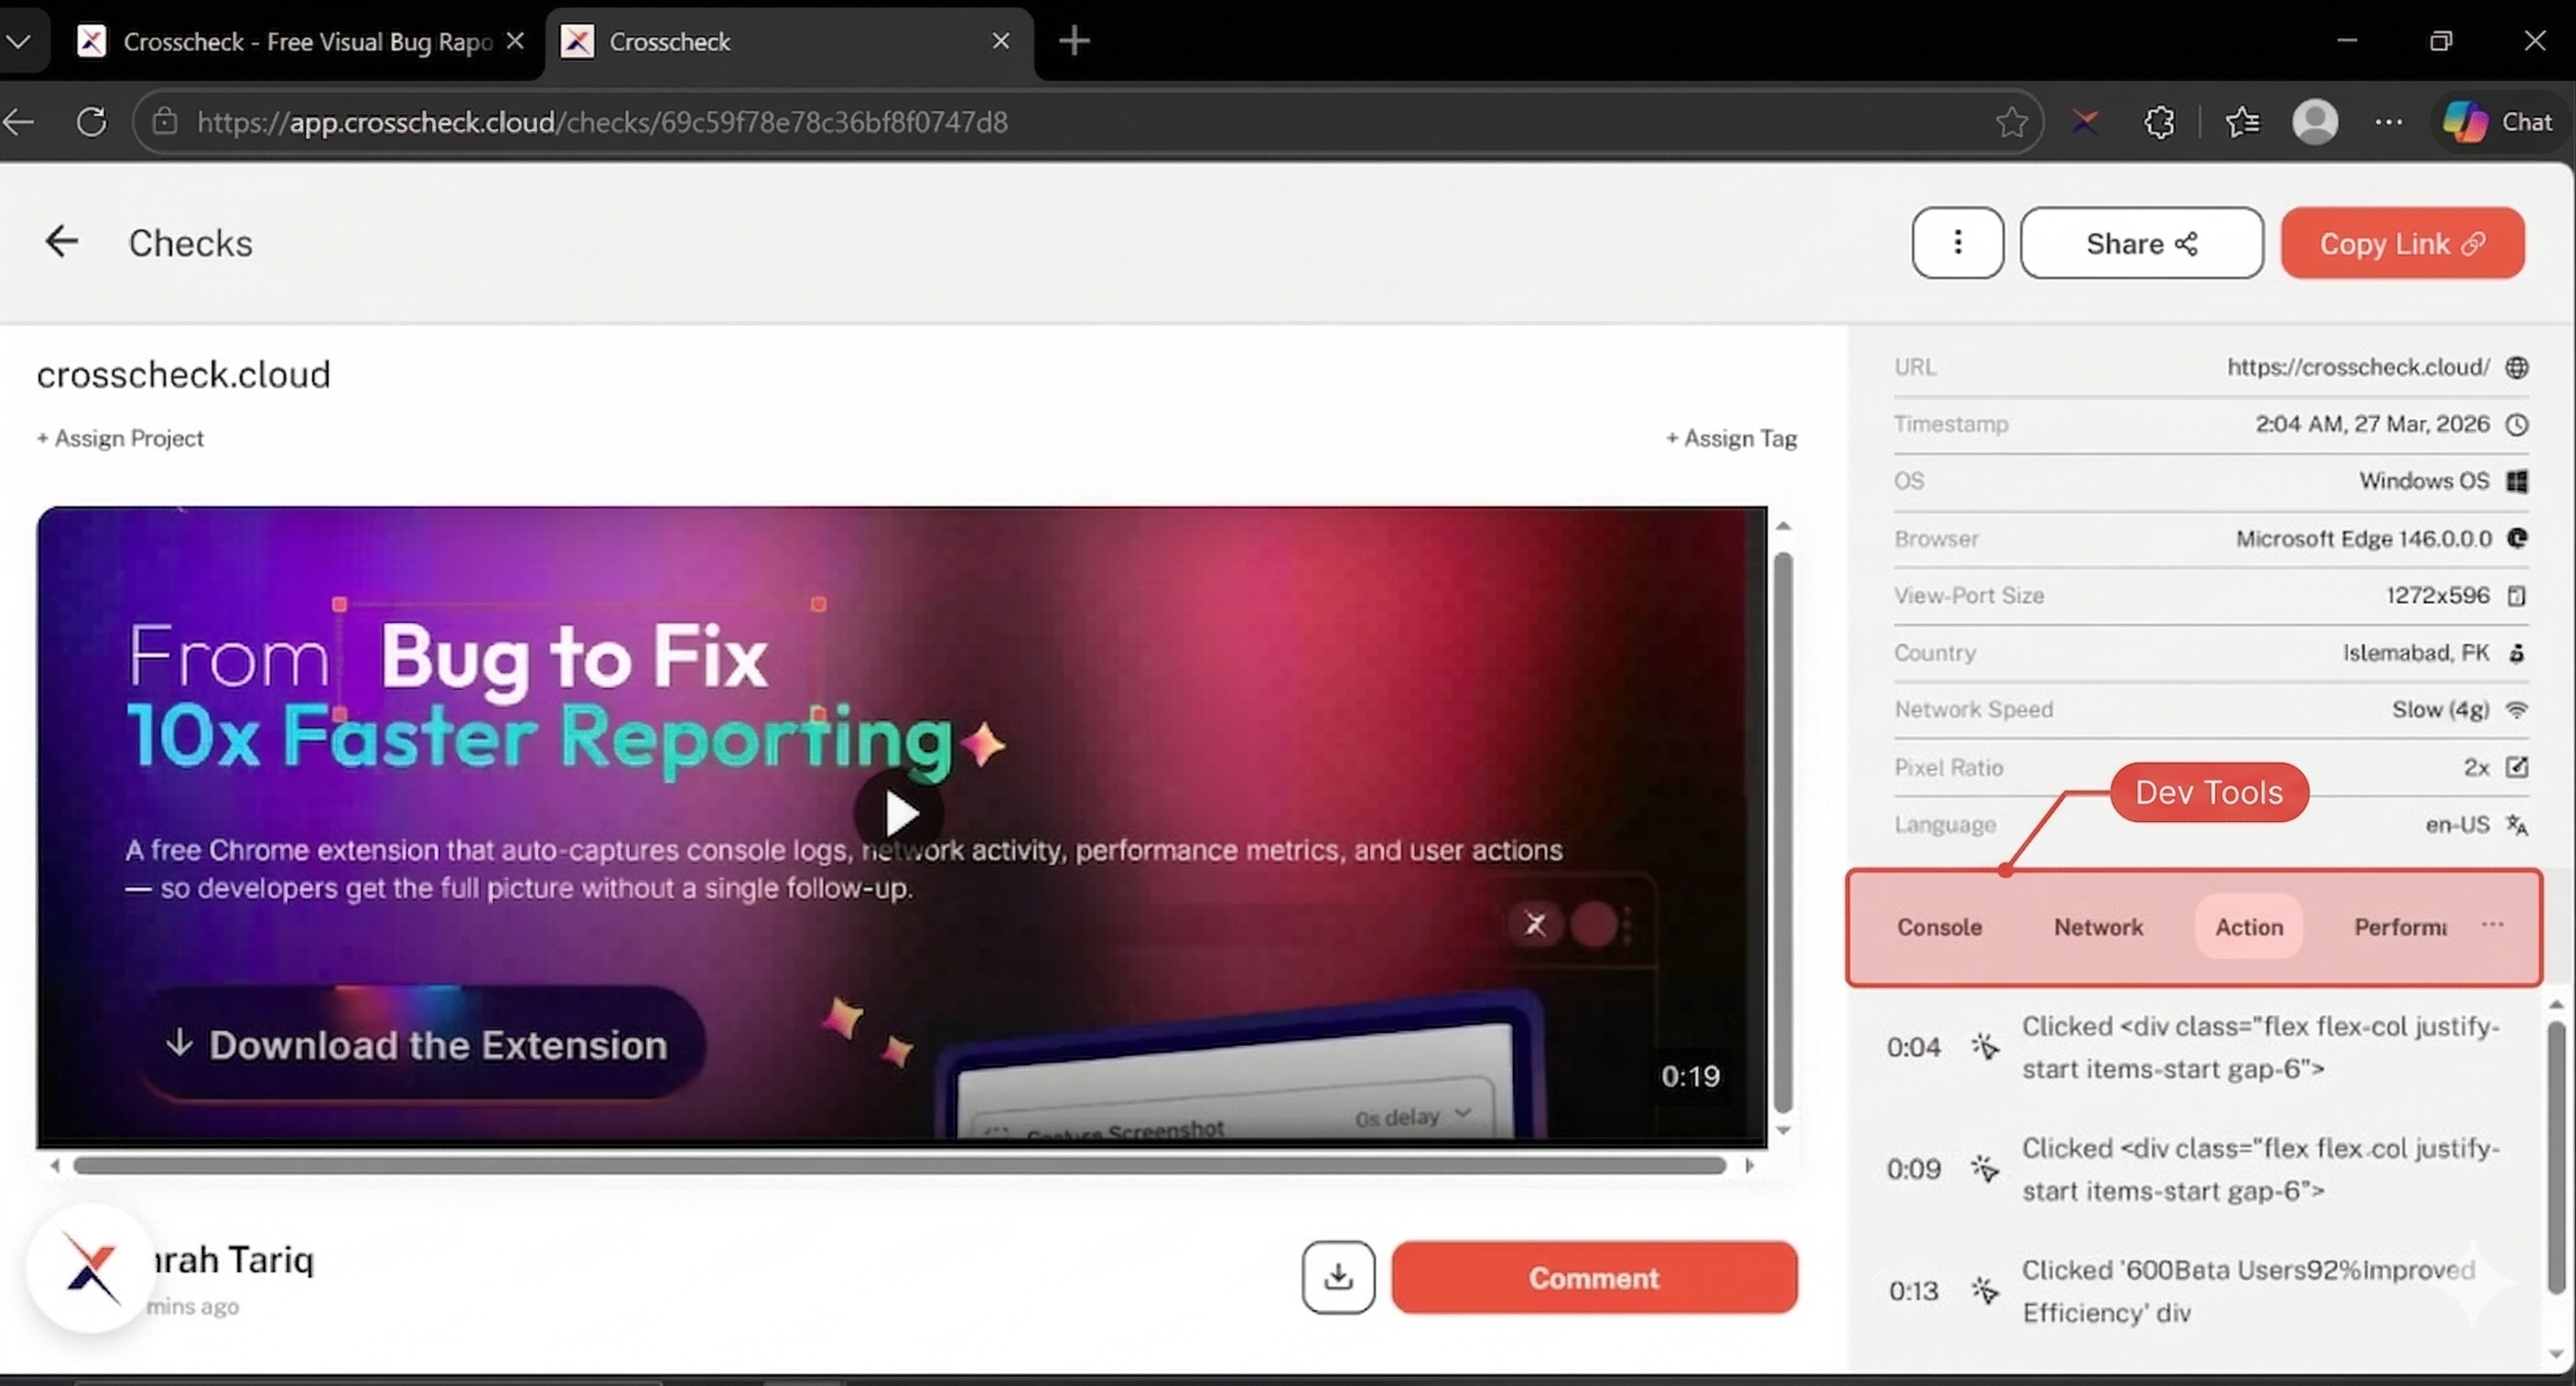
Every check in Crosscheck includes the developer context that the extension automatically captured during the session. The DevTools panel sits to the right of the media player on the check detail view and exposes that data through five tabs: Comments, Console, Network, Action, and Performance.
Comments
Comments is the default tab when you open a check. Team members can leave threaded comments, ask questions, and discuss the check without leaving the dashboard. The tab label always shows the current comment count (for example, Comments (0)), so reviewers can see at a glance whether discussion has started.
Comments posted from the orange Comment button under the media area are pinned to the current playback timestamp, so reviewers can jump straight to the moment in the recording the comment refers to.
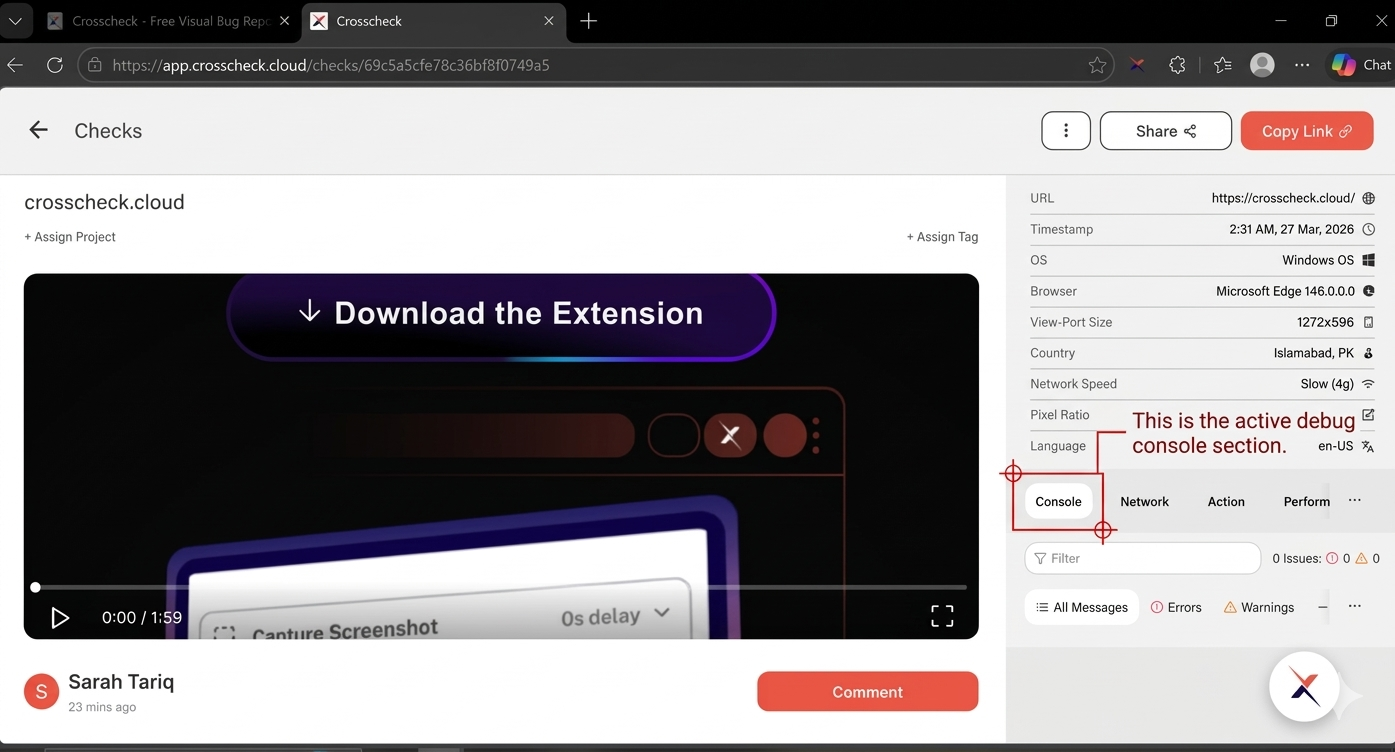
Console
The Console tab shows every message logged to the browser console during the capture session. The header includes a search Filter field on the left and an Issues counter on the right that surfaces the total number of errors and warnings in the check at a glance.
Severity filters
Below the search field, a row of chips lets you focus on a single severity:
| Filter | What it shows |
|---|---|
| All Messages | Every entry captured during the session |
| Errors | Runtime errors, uncaught exceptions, and failed assertions |
| Warnings | Deprecation notices and non-critical issues |
| Info | console.info and general informational messages |
| Runtime | Runtime-level diagnostics emitted by the browser |
Network
The Network tab lists every HTTP request the page made during the check. Use it to spot failed API calls, slow responses, or unexpected request patterns without having to reproduce the bug in your own browser.
Columns
| Column | Description |
|---|---|
| Name | The request file name or endpoint |
| Status | HTTP status code returned by the server |
| Method | HTTP method (GET, POST, PUT, DELETE, …) |
| Type | Resource type — Doc, Fetch/XHR, JS, CSS, Img, etc. |
| Size | Response payload size |
| Time | How long the request took to complete |
Resource type filters
Above the table, a row of chips filters the list by resource type: All, Fetch/XHR, Doc, CSS, JS, Font, Img, Media, WS, SSE, and Other. There is also a search Filter field for matching on URL, and an Errors Only checkbox on the right to focus on failed requests.
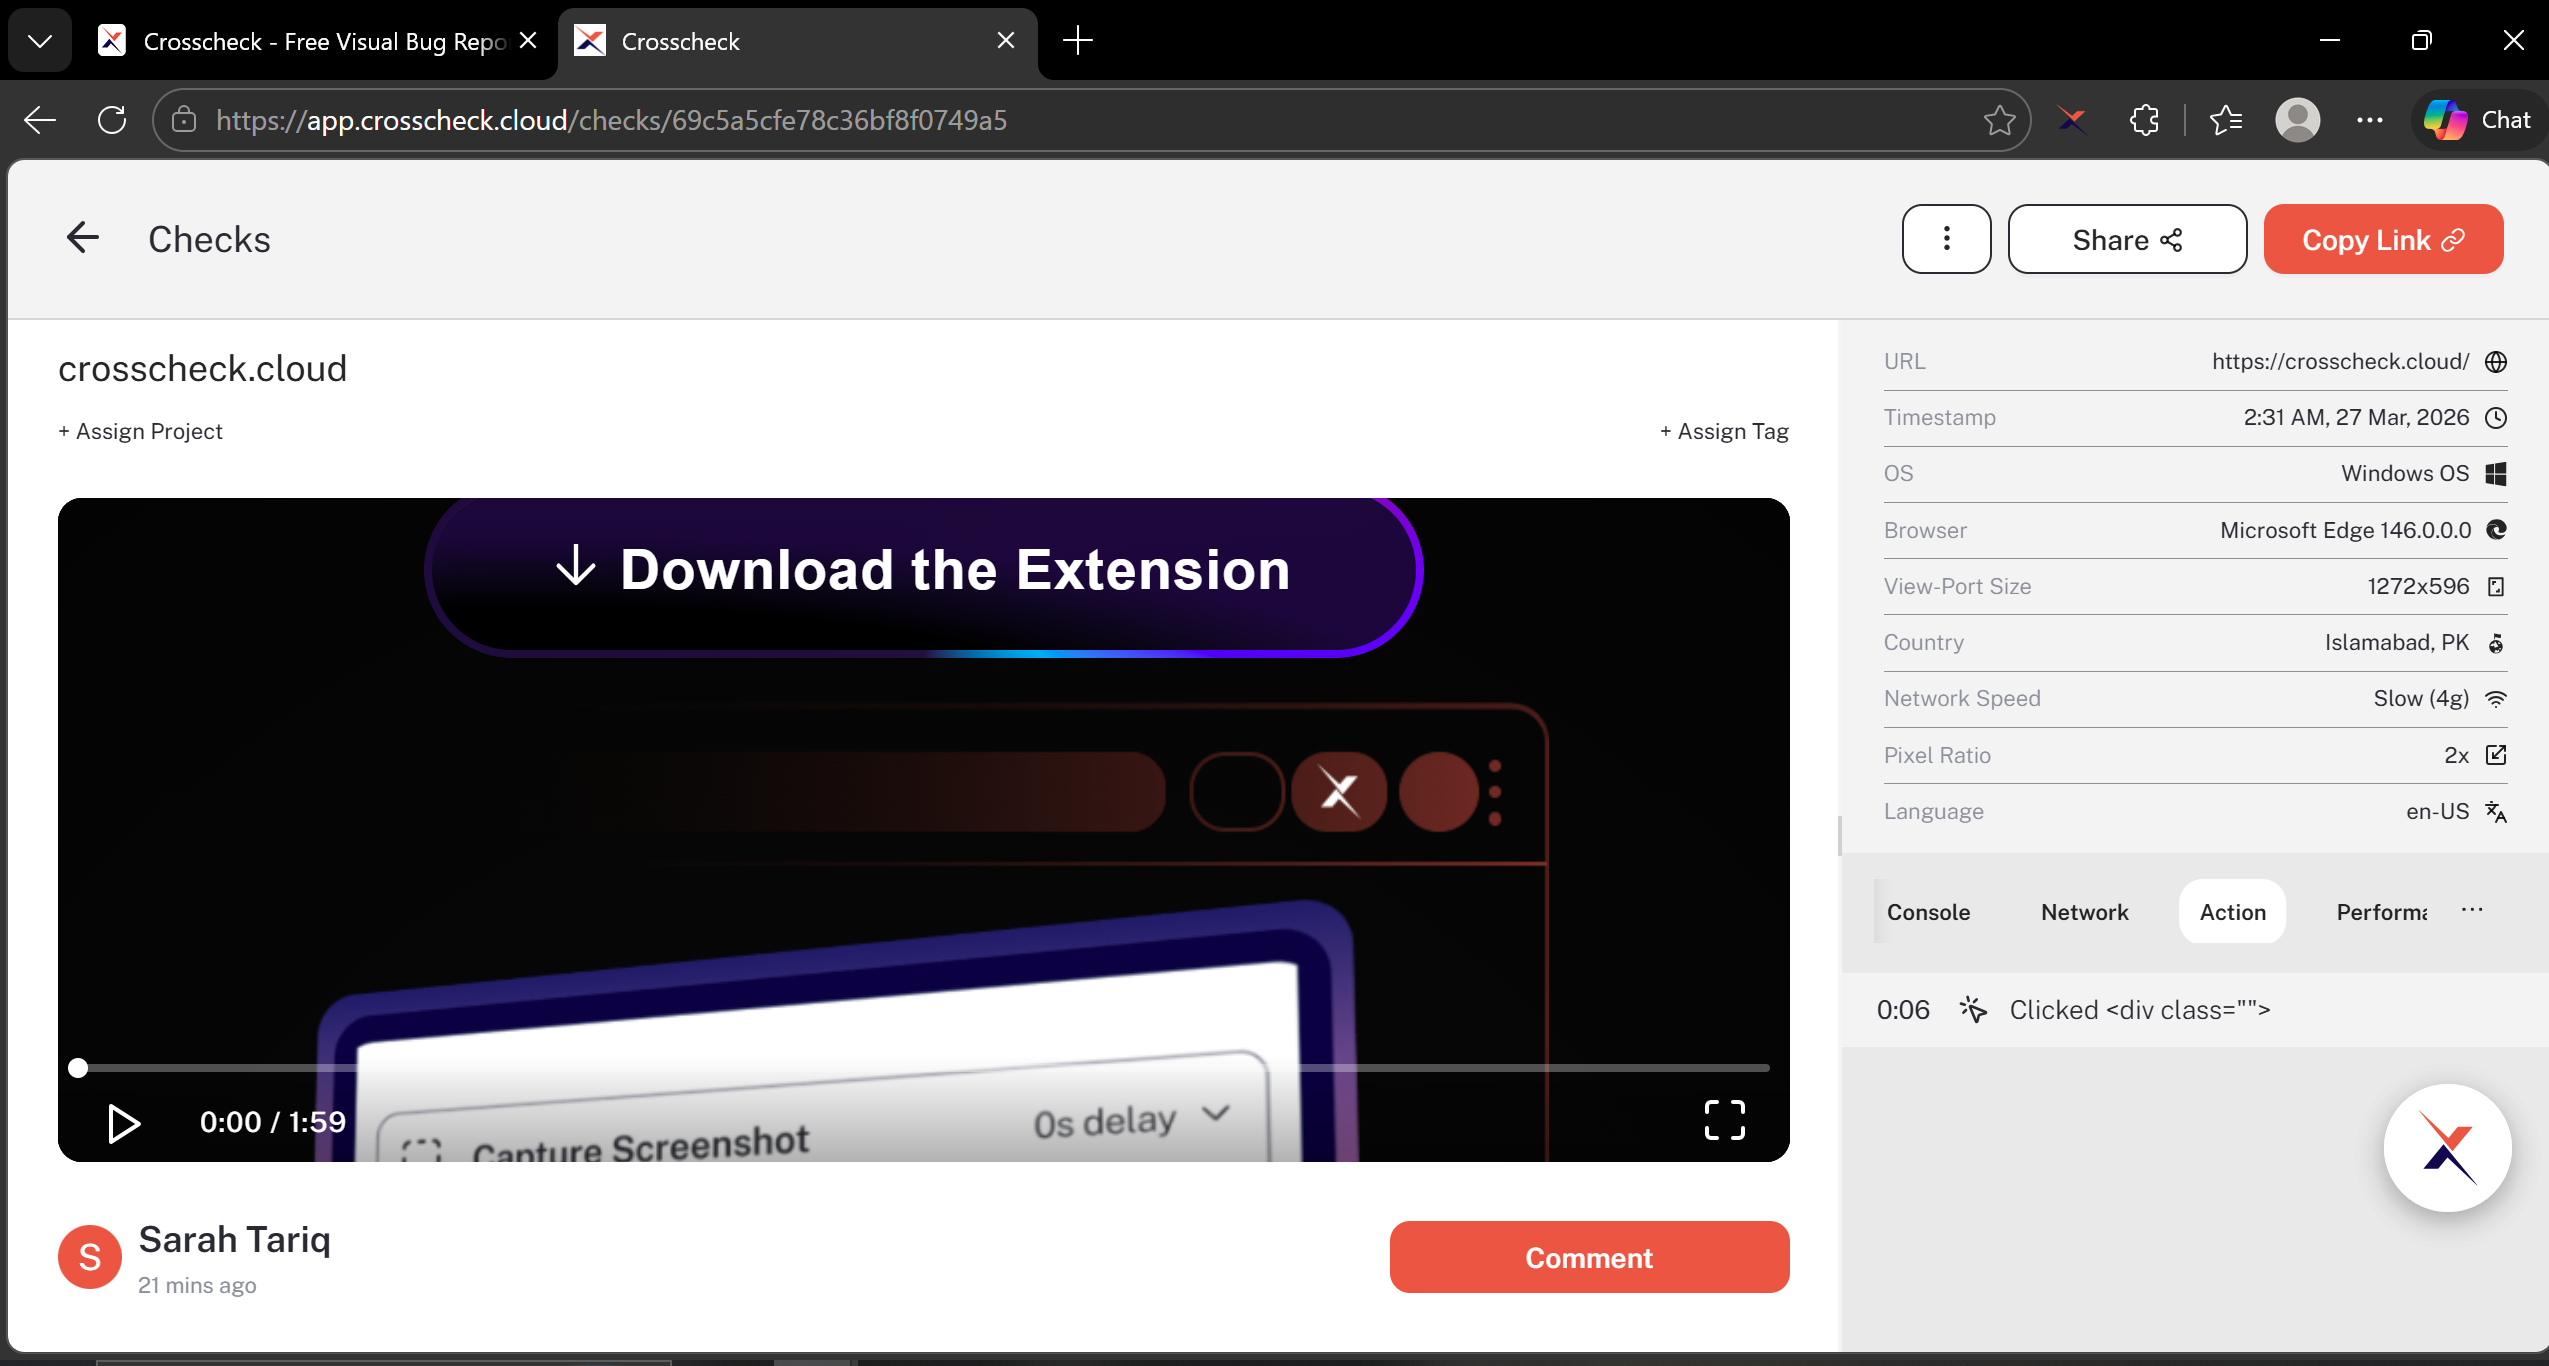
Action
The Action tab presents a chronological timeline of everything the user did during the session. Each entry is timestamped against the recording, giving reviewers a step-by-step account of the interactions that led to the captured behavior.
Tracked interactions
| Action Type | What is recorded |
|---|---|
| Click | Element clicked, its text content, and CSS selector |
| Double click | Element double-clicked, its text content, and CSS selector |
| Typed | Sequences of keypresses, grouped into a single typed event for readability |
| Navigation | Page URL changes including hash and query parameter changes |
Performance
The Performance tab summarizes page load metrics for each navigation in the check, so you can quickly diagnose slow initial renders or bottlenecked requests.
| Column | Description |
|---|---|
| Name | The navigated URL |
| TTFB | Time to first byte from the server |
| FCP | First contentful paint — when the first content was rendered |
| Load | Total time until the page finished loading |