
Screen Recording
Recording Modes
Crosscheck supports two recording modes, each suited to different testing scenarios:
| Feature | Current Tab | Full Screen |
|---|---|---|
| What is captured | Only the contents of the active browser tab | Your entire screen or a selected application window |
| Audio | System audio from the current tab, plus microphone (mute or unmute from the recording toolbar) | System audio from any tabs you open during the session, plus microphone (mute or unmute from the recording toolbar) |
| Developer context | Full devtools data (console, network, user actions) | Full devtools data (console, network, user actions) |
| Use case | Testing web applications where you want a focused recording of a single page | Capturing interactions that span multiple windows, native apps, or desktop-level workflows |
| Privacy | Only the tab content is recorded; nothing else on your screen is visible | Everything visible on your screen or selected window is recorded |
| Multi-tab / window switching | Keeps recording the original tab even if you switch away | Switch freely between tabs, windows, and apps; everything visible is captured |
| Start flow | One click — recording starts on the active tab and the timer appears immediately | Chrome share dialog asks you to pick a tab, window, or full screen, then click Share to start |
How to Record
Open Crosscheck and pick a recording mode
Click the Crosscheck icon in your browser toolbar to open the extension popup. Under the Screen Recording heading, you will see two options:
- Current Tab — Records only the active browser tab. Best for focused web app bugs.
- Full Screen — Records your entire screen or a selected window. Useful when the bug spans multiple windows or applications.
Confirm what to share
Chrome shows its standard share dialog so you can confirm exactly what gets recorded:
- For Current Tab, the active tab is selected automatically — recording starts and the live timer appears immediately.
- For Full Screen, the dialog lets you choose between the current tab, a specific tab, or your entire screen. Click Share and the timer starts.
Record and reproduce the bug
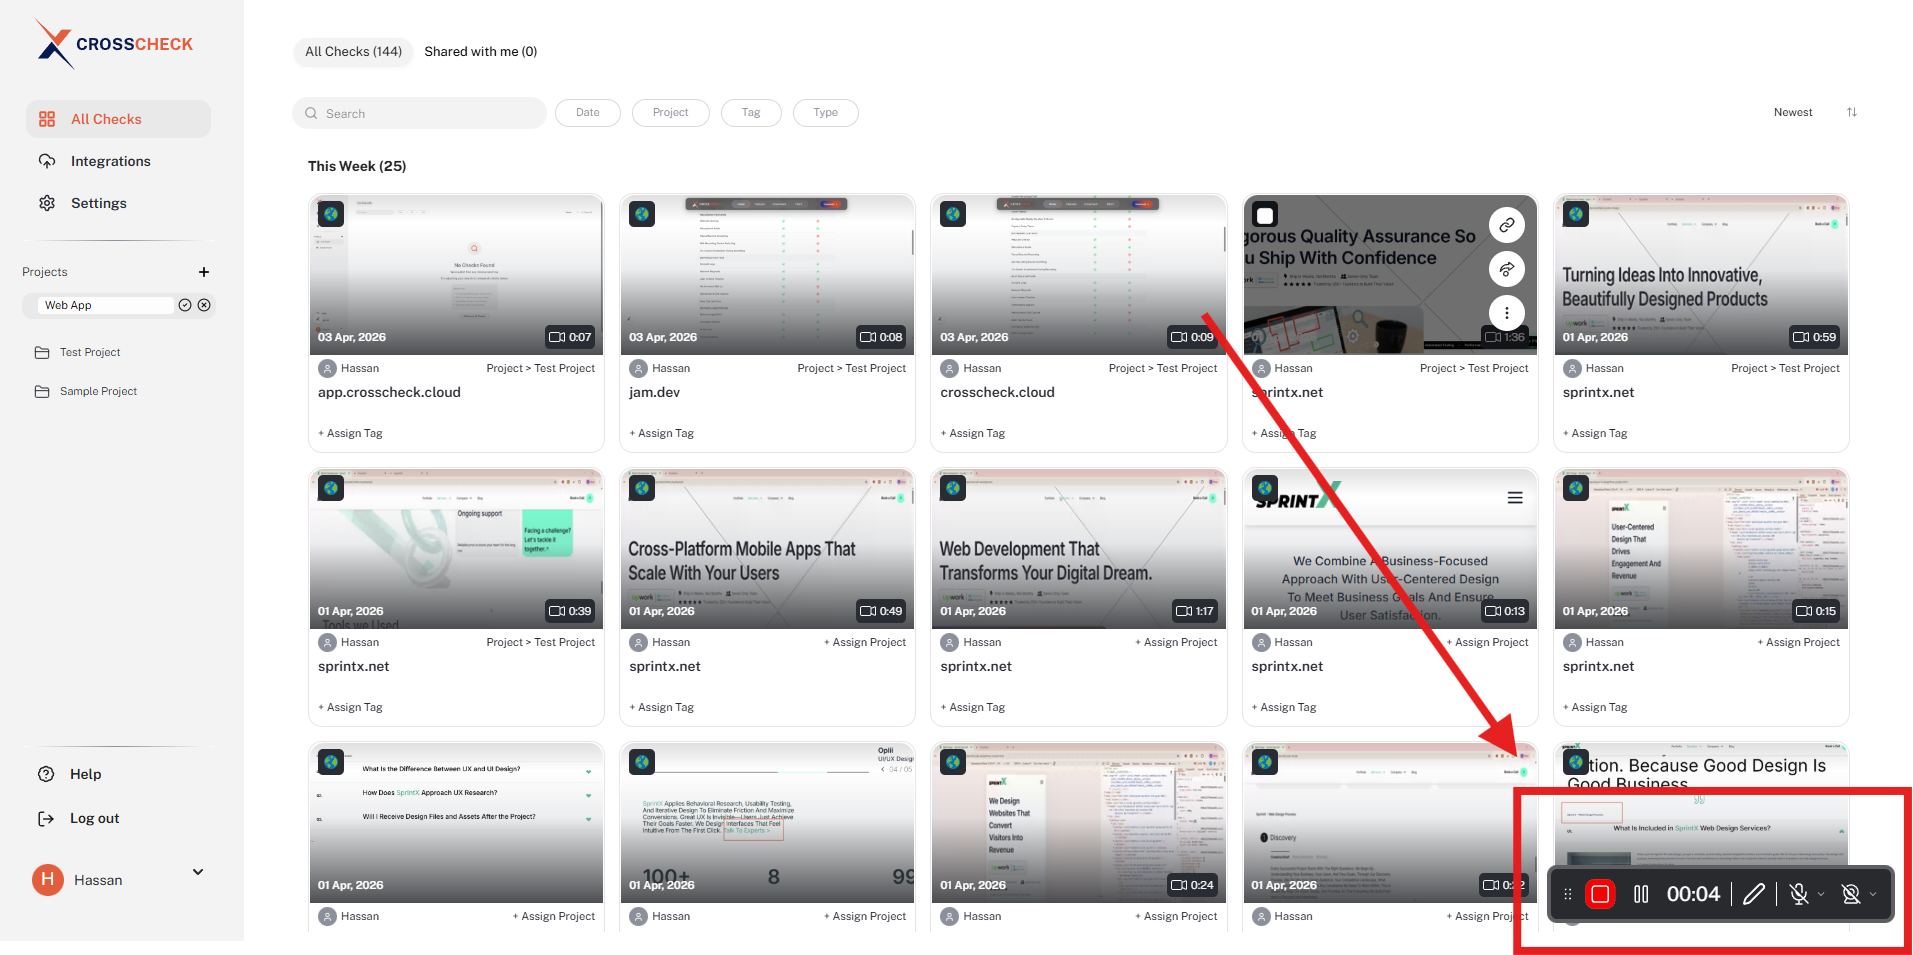
Once recording is live, a floating control toolbar appears with a timer. From the toolbar you can:
- Pause / Resume — Pause mid-recording and pick up where you left off; paused segments are excluded from the final video.
- Mic and camera — Toggle the microphone or webcam on or off mid-recording, or use the chevrons to switch input devices on the fly.
- Annotate — Open the pen icon on the recording toolbar to draw live on the page while you record. The mini annotator includes pen, rectangle, ellipse, arrow, line, text, and undo / redo, plus a size selector (S / M / L) for stroke width.
- Stop — End the recording and move to the trim and preview step.
Reproduce the bug as you normally would — every interaction is captured along with the matching console logs and network activity.
Trim and review in the preview
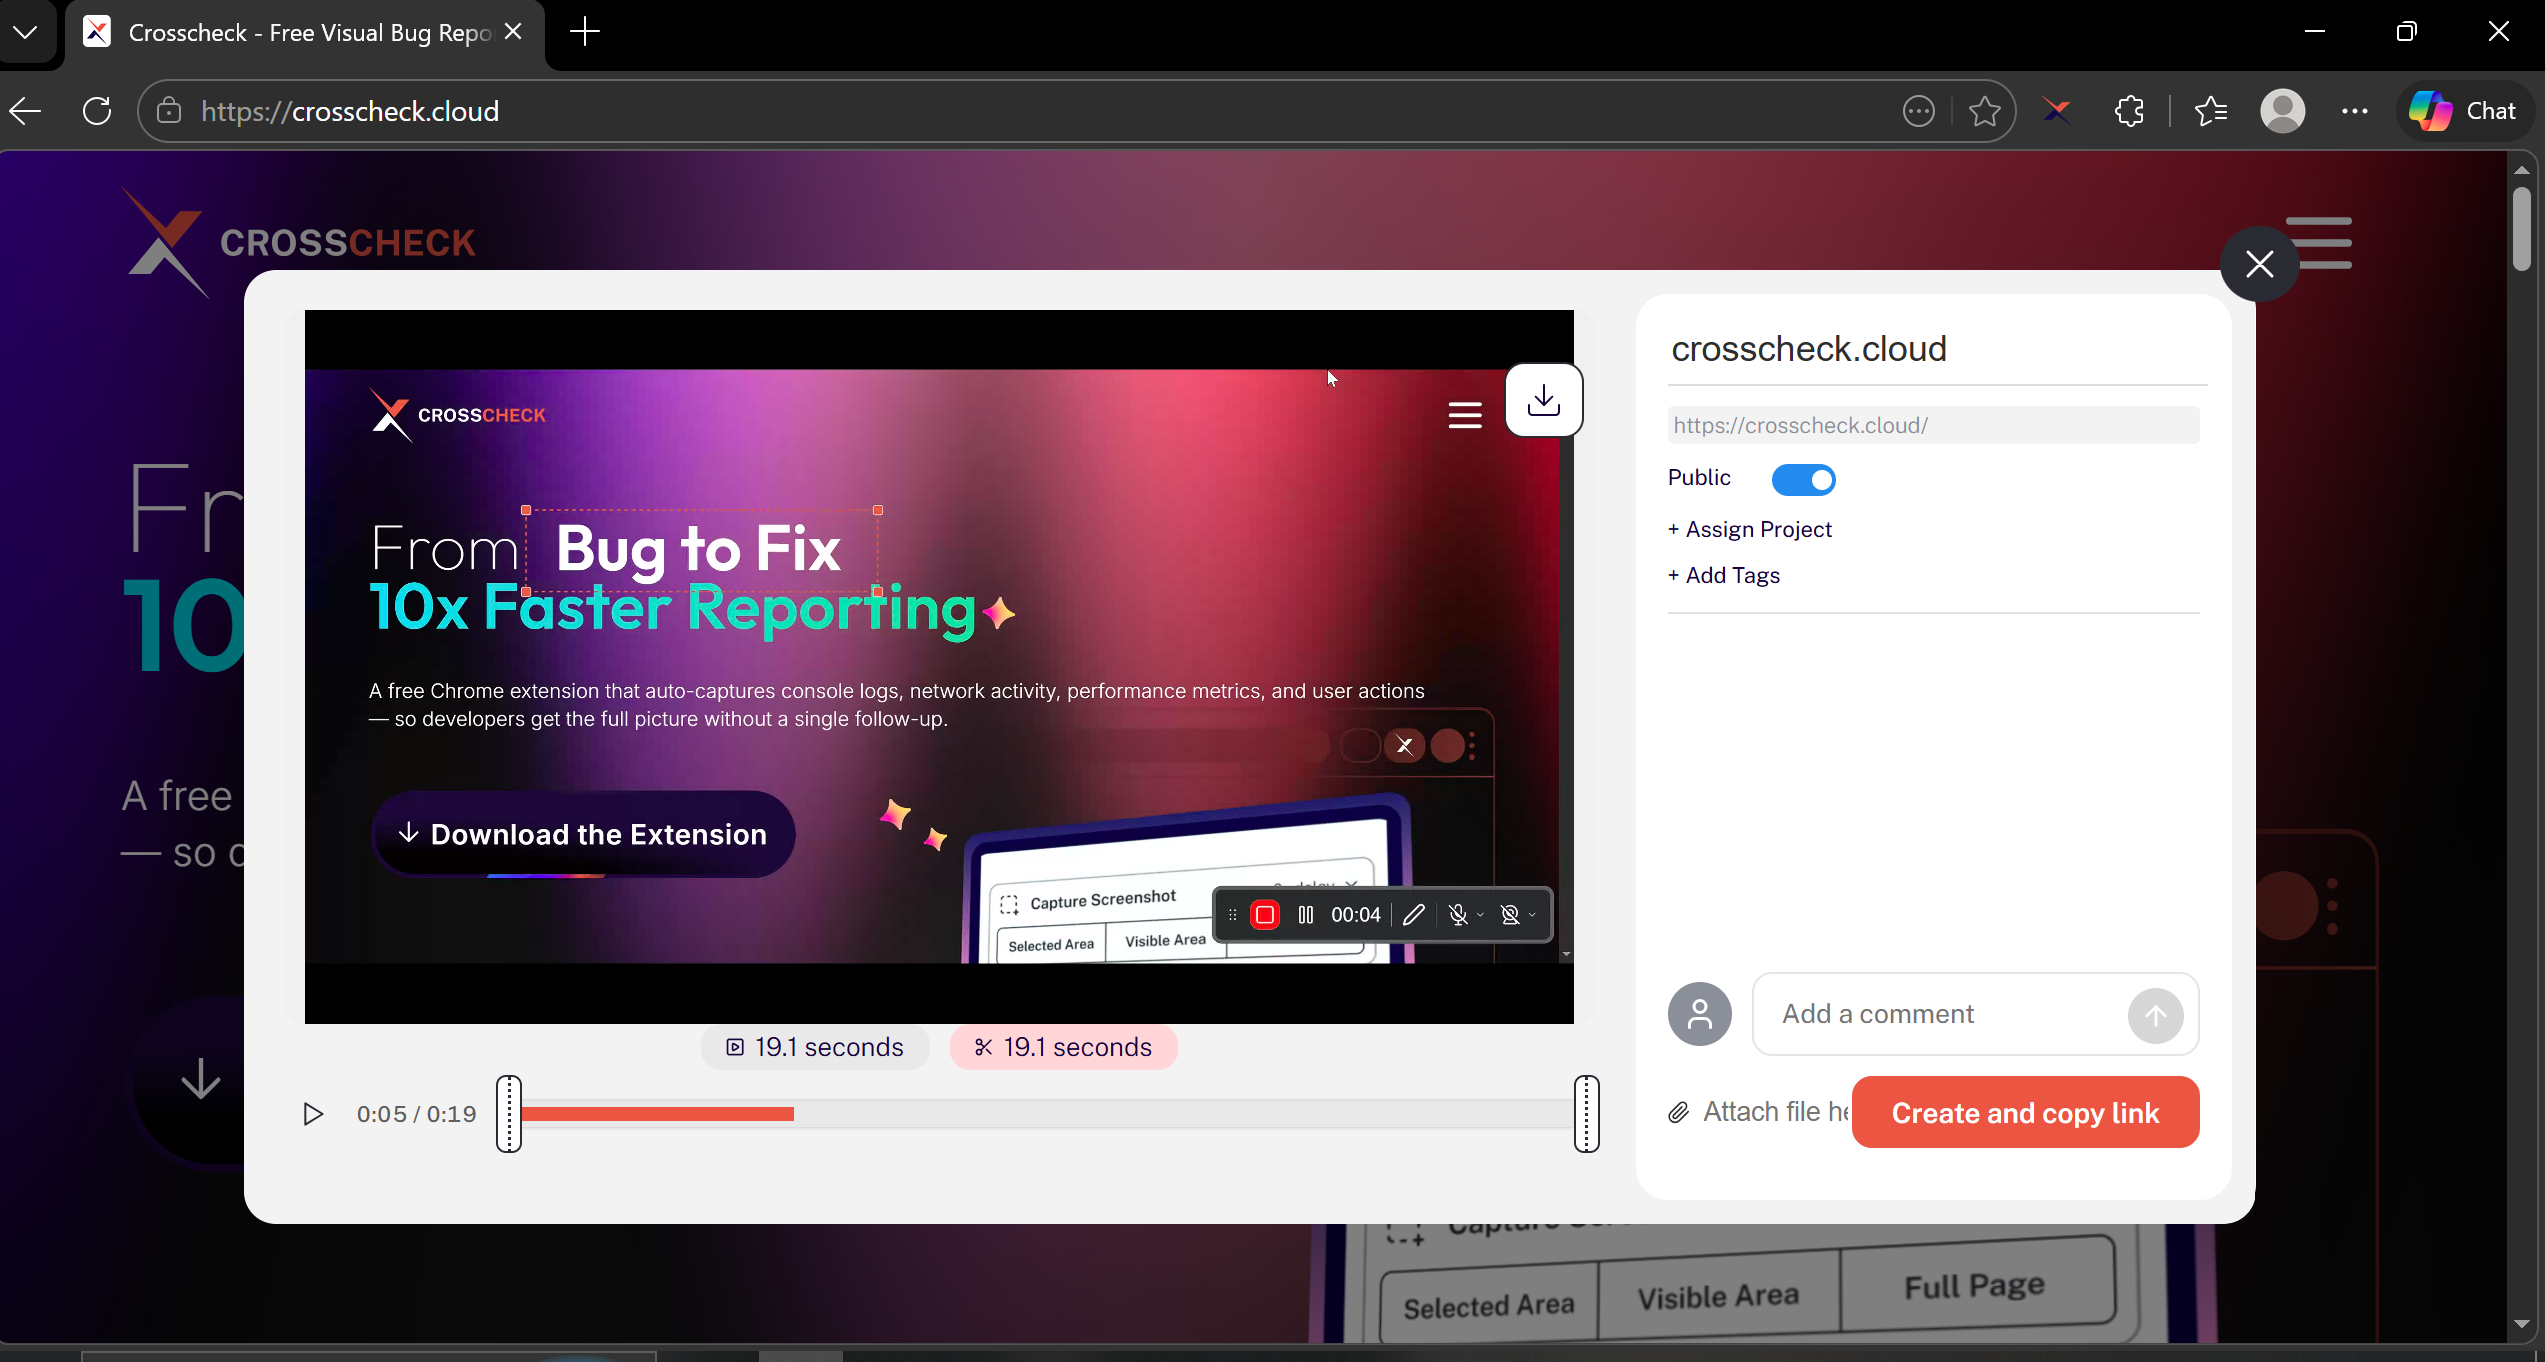
Click Stop on the floating toolbar to end the recording. A preview opens with a trim interface where you can drag the start and end handles to keep only the portion of the video that shows the bug. From the same preview side panel you can:
- Set visibility (public or private).
- Assign a project so the check lands in the right place.
- Assign tags for filtering and triage.
- Leave a comment to give reviewers context.
Create and copy link
When everything looks right, click Create and copy link. The trimmed video uploads with the synchronized developer context — console logs and network requests are remapped to the trimmed timeline. The final check opens in a new tab and is automatically saved to your Crosscheck dashboard at app.crosscheck.cloud — under the project you assigned in the preview side panel, or under All Checks if none was chosen.
If you close the recording preview without clicking Create and copy link, the check is not lost. The next time you open the Crosscheck extension popup, the pending recording is shown with two options:
- Create Check — Reopens the preview so you can finish trimming and save the check to your dashboard.
- Delete Check — Discards the pending recording permanently.
Video Processing
When you trim a recording, Crosscheck handles the rest automatically:
- Trimming — Trimming is fast because it works without re-encoding the video. This makes trimming nearly instant regardless of video length.
- Thumbnail generation — A thumbnail image is automatically extracted from the first frame of the trimmed video for use as a preview in the dashboard.
- Devtools timestamp remapping — Console logs, network requests, and user action timestamps are adjusted to match the trimmed video timeline. If you had pause/resume periods during recording, those are accounted for so that devtools events stay in sync with video playback.
Output Format
Recordings are saved as video files along with their developer context data (console logs, network requests, user actions). A thumbnail is automatically generated for preview in the dashboard.