Capturing Bugs
Screenshots
Capture Modes
Crosscheck offers three screenshot modes to cover different scenarios:
| Mode | What it captures | Best for |
|---|---|---|
| Visible Area | The currently visible area of the browser tab | Quick checks of UI bugs, layout issues, or error states visible on screen |
| Full Page | The entire scrollable page from top to bottom, stitched into a single image | Long pages, scrollable content, or when you need to capture context above and below the fold |
| Selected Area | A specific rectangular region of the screen that you select by clicking and dragging | Focusing on a particular UI element or section without capturing the entire page |
How It Works
When you take a screenshot, Crosscheck performs several steps behind the scenes to create a rich, contextual check.
1
Trigger the capture
Click the screenshot button in the Crosscheck extension popup, or use the floating toolbar on the page. Select visible area, full-page, or selected area mode. You can also set an optional capture delay (0, 3, or 5 seconds) to prepare the page state before the screenshot is taken.
2
Image capture
For visible area screenshots, the extension captures the currently visible area of your current tab as a high-resolution PNG. For full-page mode, it scrolls through the entire page, capturing each segment, then automatically stitches them together to produce one seamless image. For selected area mode, you click and drag to define the region you want to capture.
3
Developer context collection
Simultaneously, the extension collects developer context that was being tracked since the page loaded. This includes console logs, network requests (with status codes, timings, and payloads), and a timeline of user actions such as clicks, keypresses, and navigation events.
4
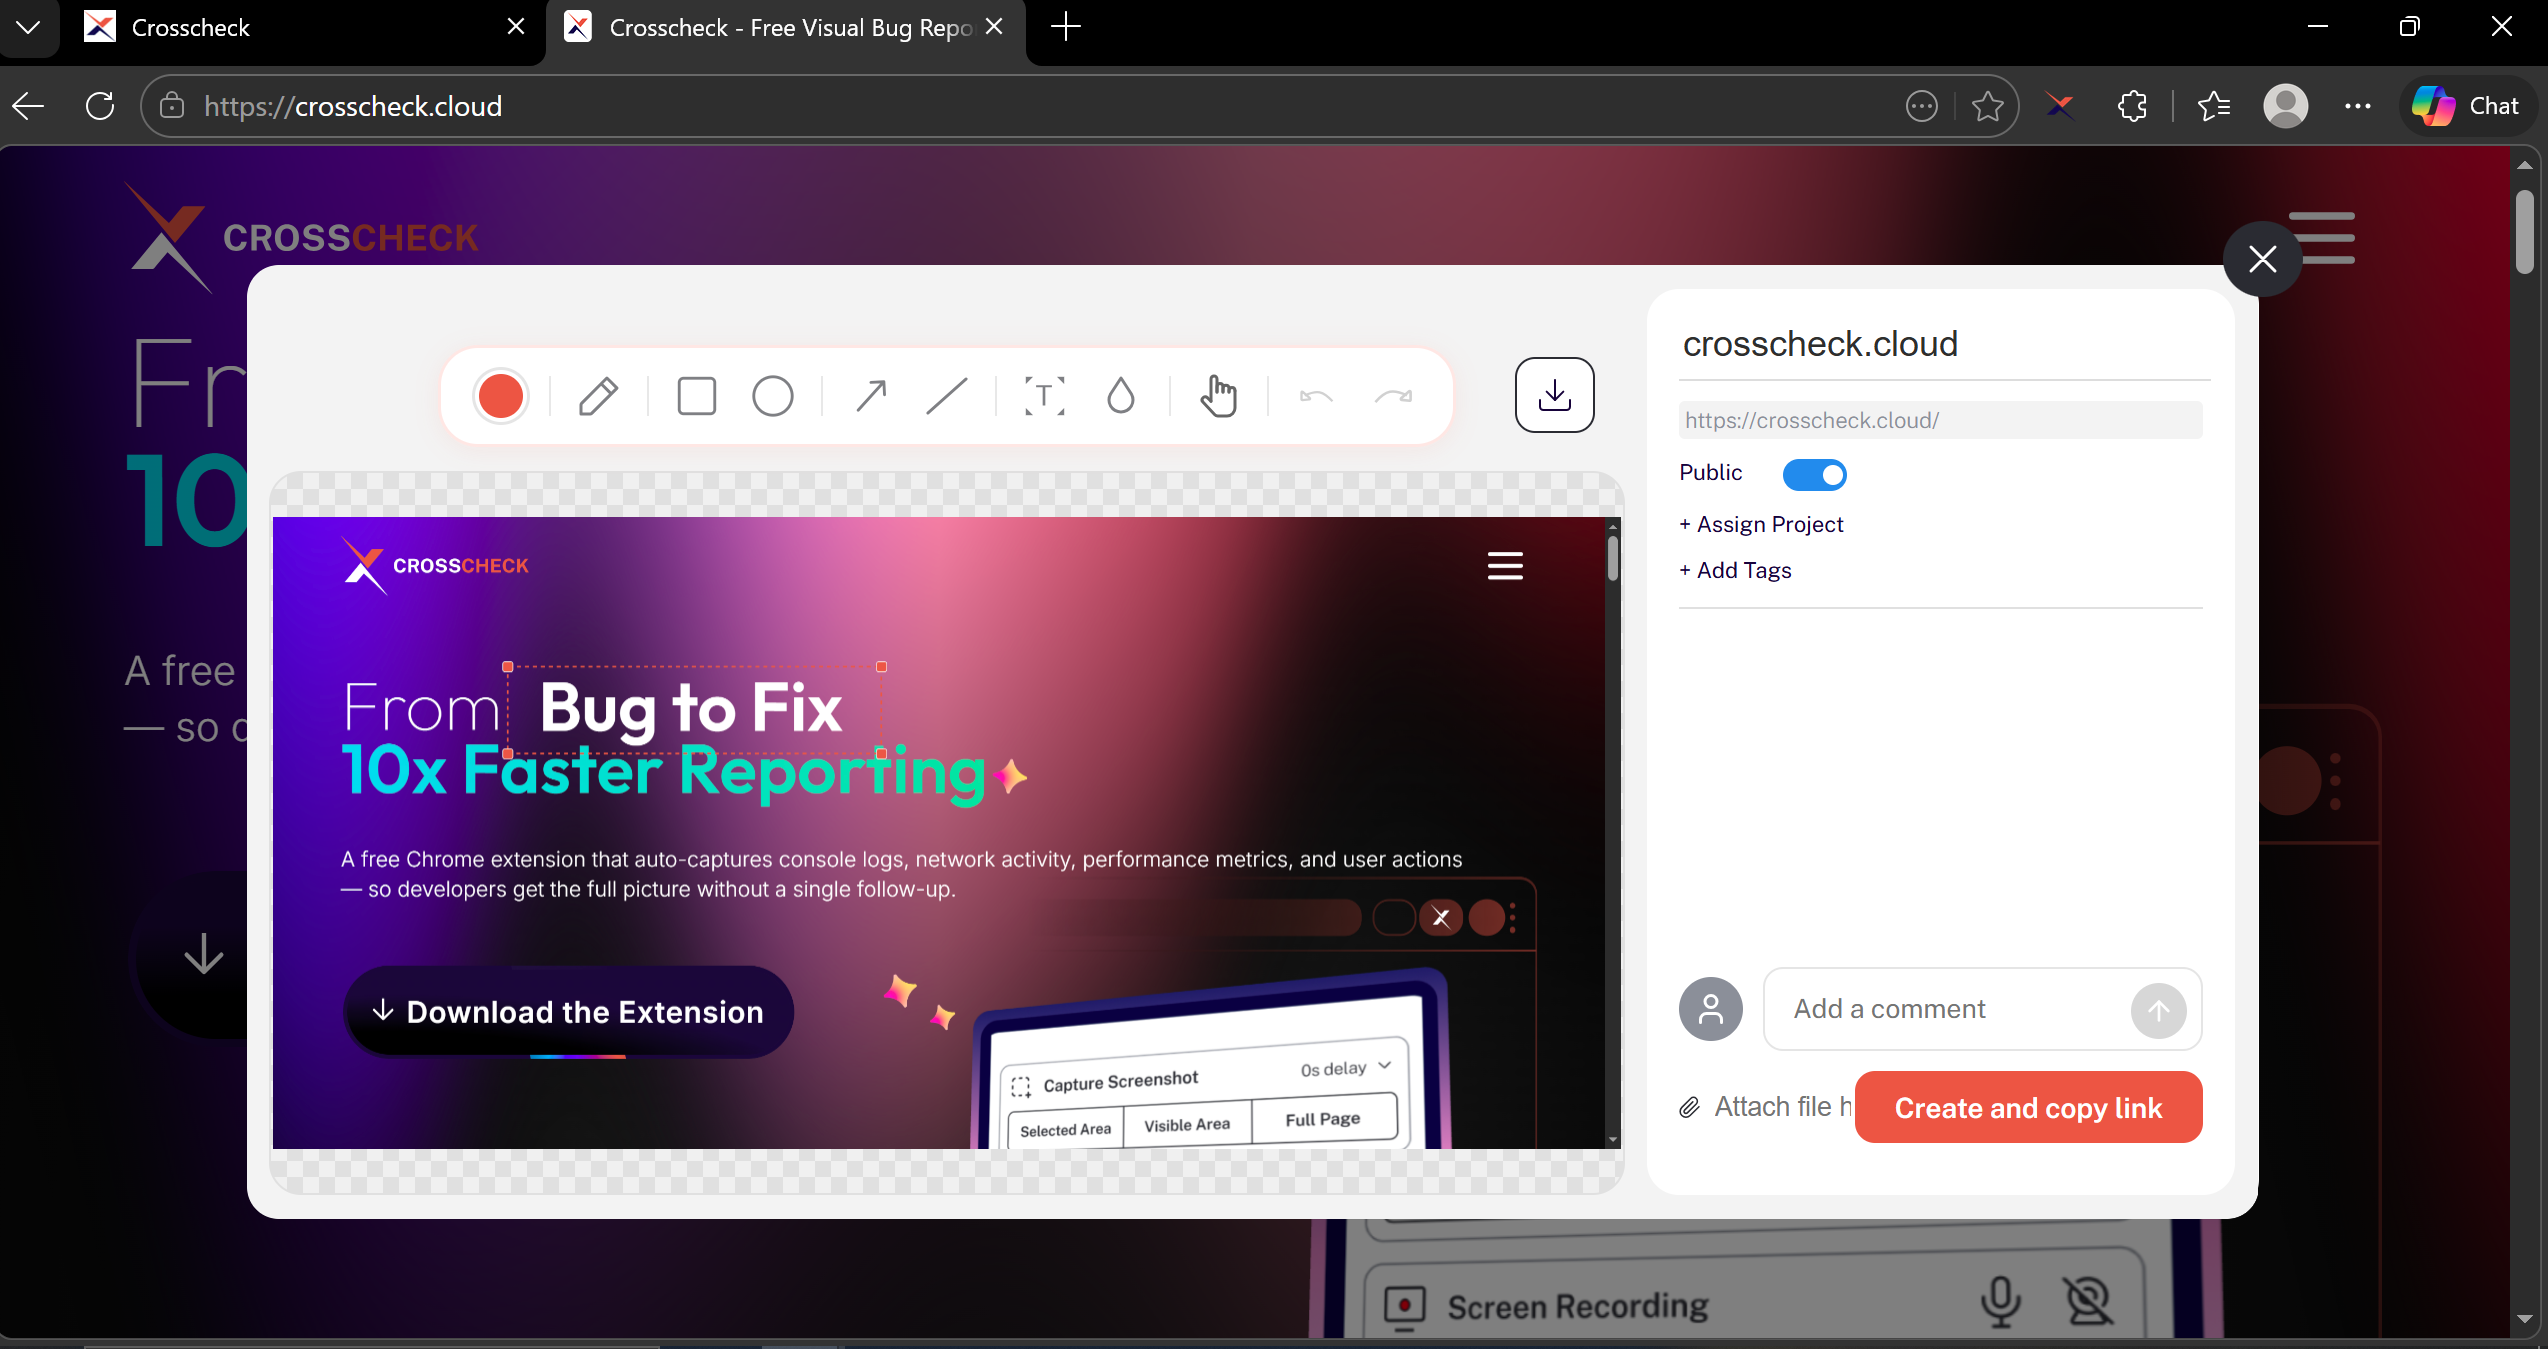
Annotate (optional)
After the screenshot is captured, the annotation editor opens immediately. You can draw arrows, add text, highlight areas, blur sensitive content, or add shapes to clearly communicate the issue. Skip this step if no annotation is needed.
5
Create and copy link
Use the preview side panel to set visibility (public or private), assign a project, add tags, and leave a comment. When everything looks right, click Create and copy link. The screenshot and its developer context — console logs, network requests, and the user action timeline — are uploaded to your workspace, and the final check opens in a new tab so you can review or share it immediately. It is automatically saved to your Crosscheck dashboard at app.crosscheck.cloud — under your selected project, or under All Checks if none was chosen.
Developer context is always captured
Whether you take a visible area or full-page screenshot, the same set of developer context data is collected: console logs, network requests, performance metrics, and user action timeline. This data is attached to the check and viewable in the dashboard detail view.
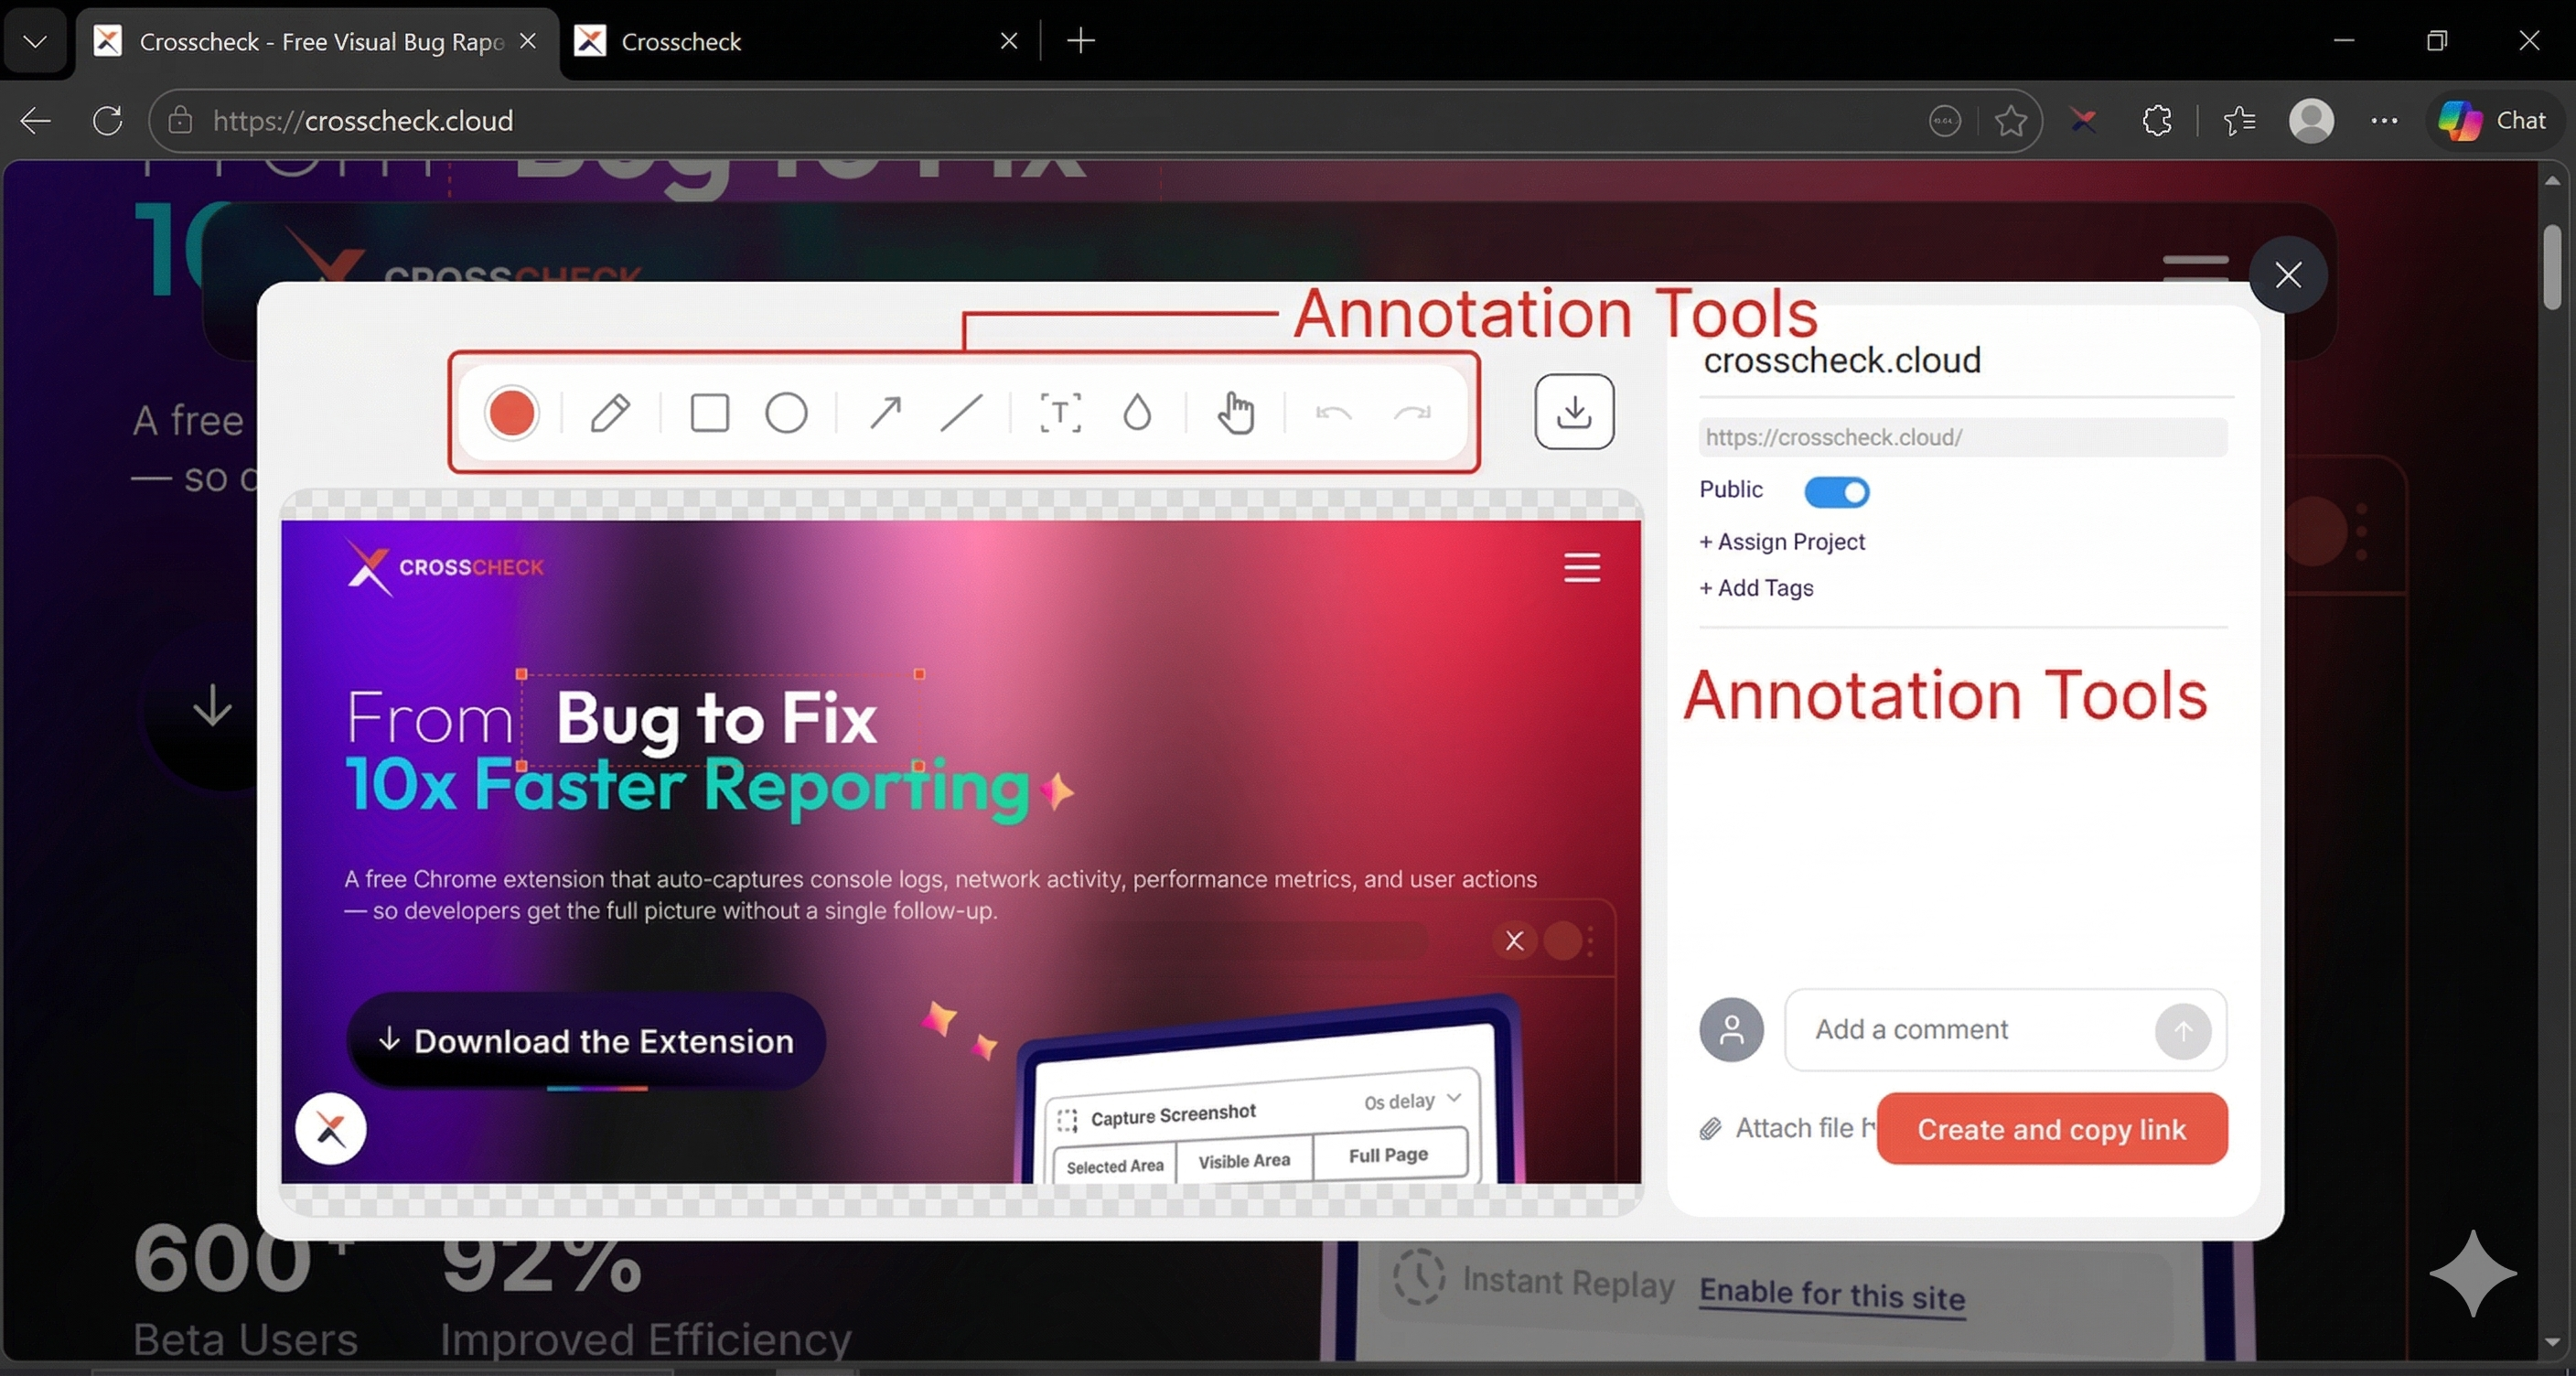
Annotation After Capture
The built-in annotation editor uses a canvas-based drawing system that supports arrows, rectangles, circles, freehand drawing, text labels, and a blur tool for redacting sensitive information. Annotations are non-destructive: the original screenshot is preserved alongside the annotated version.
Full-page screenshots on long pages
Full-page capture works by scrolling the page programmatically and automatically stitching multiple viewport-sized segments together. On very long pages, this may take a few seconds. Elements with fixed positioning (like sticky headers) are handled automatically to avoid duplication in the final image.
Keyboard shortcuts
Use Alt+Shift+S to quickly take a Selected Area screenshot and Alt+Shift+V for a Visible Area screenshot without opening the extension popup.
Output Format
Screenshots are saved as PNG files for lossless quality. The developer context data (console logs, network requests, user actions) is saved alongside the screenshot and accessible from the dashboard.
Last updated: March 2026