How to capture and share network logs for debugging
To capture network logs for debugging, open the browser's Network panel (Chrome, Firefox, Safari, or Edge DevTools), tick Preserve log and Disable cache, reproduce the bug, then right-click the request list and choose Export HAR (sanitized) — the resulting .har file contains every request, header, payload, and timing measurement in shareable JSON. To share network logs safely, always export the sanitized variant (Chromium 130+ strips Cookie, Set-Cookie, and Authorization headers by default), then strip any remaining PII before attaching the file to a Jira, Linear, or GitHub ticket alongside a clear pointer to the specific failing request.
Key takeaways
- HAR file is the W3C-style JSON archive format every major browser exports — same schema in Chrome, Firefox, Safari, and Edge.
- Chrome 130+ defaults to sanitized HAR exports. Switch to "with sensitive data" only when the recipient is internal and trusted.
- For native mobile or non-browser traffic, you need a system-level proxy — Charles Proxy ($50/user) or Proxyman for HTTP/S, Wireshark when the bug sits below the HTTP layer.
- Mobile Safari requires the Web Inspector toggle on iOS plus a USB-tethered Mac running desktop Safari.
- A HAR file alone is rarely enough — attach it with a one-line pointer to the failing request, the timestamp, and the user role, or expect the developer to come back with questions.
What a network log actually contains
A network log is the browser's recording of every HTTP and WebSocket conversation the page initiates while DevTools is open — request URL, method, status, headers in both directions, request body, response body, timing breakdown, and the initiator that triggered the call. Together those fields are enough to diagnose most frontend and API bugs without ever opening a server log.
The HAR (HTTP Archive) format is the shareable export of that recording — a single JSON document, defined by the W3C Web Performance Working Group, that every major browser writes and reads. That portability is what makes HAR files the lingua franca between QA, frontend, backend, and vendor support: a Firefox-captured HAR opens cleanly in Chrome's HAR Viewer, in Charles Proxy, and in Google's online HAR Analyzer.
What lives inside the file: request line (URL, method, HTTP version), status code, headers in both directions (including Authorization, Cookie, Content-Type, Access-Control-Allow-Origin, Cache-Control, ETag), request payload, response body, timing breakdown, and the initiator — the line of JavaScript or markup that triggered the request.
That last field is the one most people miss. A failing /api/orders call with an initiator pointing to checkout.tsx:182 collapses a triage conversation that used to take an hour.
How to capture network logs in Chrome and Edge
Chrome and Edge share the same DevTools codebase, so the workflow is identical.
- Open DevTools (
F12orCmd+Option+I) and click the Network tab. - Tick Preserve log so requests survive page navigations — login redirects, checkout flows, anything that crosses a route change.
- Tick Disable cache to force the browser to re-request every resource. Cached responses can mask a stale CDN asset, a missing CORS header, or a 304 hiding a server change.
- Reload the page and reproduce the bug.
- Right-click anywhere in the request list and choose Save all as HAR (sanitized), or click the export icon in the panel toolbar.
The filter bar at the top of the panel matters when a page issues hundreds of requests. Click Fetch/XHR to hide static asset noise, type status-code:4 to isolate 4xx responses, or prefix a search term with - to exclude matches. For searching inside payloads — not just URLs — open the search drawer with Cmd+F / Ctrl+F while the Network panel has focus.
Sanitized vs full HAR exports
Chromium 130+ ships with sanitized HAR exports as the default. The sanitized file strips Cookie, Set-Cookie, and Authorization headers — the three biggest leak vectors. If the sanitized file hides too much, open DevTools settings (F1), find Network, and tick Allow to generate HAR with sensitive data. A second export item then appears: Export HAR (with sensitive data).
Use the unsanitized export only when the recipient is on your own team and the ticket lives in a private tracker. Never paste an unsanitized HAR into a public GitHub issue, a vendor support portal, or a Slack channel that includes contractors.
How to capture network logs in Firefox
Open Firefox DevTools with F12 or Cmd+Option+E, then click Network. The throttling dropdown at the top is useful when reproducing a "works on my machine" bug against a 3G profile; the persistent-logs equivalent of Chrome's checkbox is Persist Logs.
To export, right-click the request list and choose Save All As HAR. Firefox writes the same W3C-schema JSON file Chrome does — but its export does not sanitize cookies or auth headers automatically. Treat every Firefox HAR as if it contains a working session token until proven otherwise. The cleanest fix is to open the file in a JSON editor and replace each value under cookies and headers with a placeholder like <redacted> rather than deleting the entry. Keeping the field tells the developer the header was set, just not what its value was.
How to capture network logs in Safari and mobile Safari
Safari hides DevTools behind a setting. On macOS, open Safari > Settings > Advanced and tick Show features for web developers. The Develop menu then appears in the menu bar. Open the Web Inspector with Cmd+Option+I and click Network.
Safari's export is Export HAR from the right-click menu of the request list. It writes the same JSON schema, though some Safari-specific fields appear as null when opened in Chrome.
For mobile Safari on iOS or iPadOS:
- On the iOS device, open Settings > Apps > Safari > Advanced and turn on Web Inspector.
- Connect the device to a Mac via USB cable.
- On the Mac, open Safari and look in the Develop menu — the connected device appears as a submenu, with each open tab listed underneath.
- Click the tab you want to inspect. A desktop Web Inspector window opens, attached to the mobile session. The Network tab works exactly as it does for desktop Safari.
This is the only sanctioned way to read live network traffic from mobile Safari. There is no on-device equivalent, and Apple has resisted adding one for a decade.
For Android Chrome, the equivalent flow uses chrome://inspect#devices on a desktop Chrome attached to a USB-tethered Android device with USB debugging on. The mobile traffic surfaces in a desktop DevTools window with the same Network panel and the same HAR export.
When DevTools is not enough — Charles, Wireshark, mitmproxy
DevTools only sees traffic the browser initiates. For native mobile apps, desktop apps, or background system traffic, you need a system-level proxy.
| Tool | Layer | Cost | Modifies traffic | Best for |
|---|---|---|---|---|
| Charles Proxy | HTTP/HTTPS (L7) | ~$50/user | Yes | Native mobile, request rewriting, throttling |
| Proxyman | HTTP/HTTPS (L7) | Freemium | Yes | macOS-native alternative to Charles |
| mitmproxy | HTTP/HTTPS (L7) | Free, open source | Yes | Scriptable, CLI-first, CI pipelines |
| Wireshark | Packets (L2–L7) | Free, open source | No | TCP/DNS/TLS handshake debugging |
| Browser DevTools | HTTP/HTTPS (L7) | Free | Limited | Web pages and SPAs |
The general rule: stay in DevTools when the bug is in a browser tab. Reach for Charles or Proxyman when the bug is in a native mobile app or when you need to rewrite a response to test an error path. Reach for Wireshark only when the bug looks like it sits below HTTP — a stalled TLS handshake, DNS that doesn't resolve, a TCP reset.
Charles and Proxyman both export HAR files, so the downstream sharing flow stays the same. Wireshark exports .pcap, which carries more low-level detail but requires Wireshark itself to read — a barrier for most frontend developers receiving the report. For mobile QA teams the typical setup is a Charles license per tester with a per-device root certificate installed so HTTPS decrypts cleanly; the Charles SSL proxying docs are the canonical reference.
Reading status codes and timing without getting lost
HTTP status codes carry most of the diagnostic signal. 2xx is success, 3xx is redirection (with 304 Not Modified indicating a cached response), 4xx is a client error (401 Unauthorized, 403 Forbidden, 404 Not Found, 422 Unprocessable Entity), and 5xx is a server error (500, 502 Bad Gateway, 503 Service Unavailable, 504 Gateway Timeout).
A 4xx means the request itself was wrong — wrong endpoint, missing token, malformed JSON — and the fix is almost always client-side. A 5xx means the server failed to handle a valid request, and the fix lives in the backend or infrastructure. That distinction alone saves hours of triage.
The Timing tab breaks each request lifecycle into phases. The one to watch is Waiting (TTFB) — time to first byte — which measures how long the server took to start responding. A 1.8-second TTFB points the investigation at database queries, upstream calls, or compute-heavy handlers. A long Content Download phase points at payload size or compression.
For a fuller walkthrough of timing analysis, see the Chrome DevTools performance auditing guide.
How to share network logs without leaking secrets
A HAR file is JSON, which makes it grep-able and readable in any text editor — and which is also why a careless export can leak production session tokens to anyone with the ticket link.
A practical redaction pass before sharing:
- Use the sanitized export when the recipient is external — vendor support, a contractor's tracker, a public GitHub issue.
- Search for known secret patterns:
Bearer,eyJ(the start of most JWTs),api_key=,password=,Authorization,Set-Cookie. Replace values with<redacted>rather than deleting the line. - Strip PII from request and response bodies. Emails, full names, billing addresses, and internal user IDs routinely sit in API payloads.
- Re-open the HAR in a viewer — drag it back into the Chrome Network panel, or use Google's HAR Analyzer — and skim for anything you wouldn't paste in a screenshot.
- For tooling-assisted redaction, the SanitizHAR Chrome extension lets you pick header keys and query params to wipe before export.
Even a sanitized HAR can leak. If the page loaded a profile endpoint that returned the user's email in the body, that email is in the file. Sanitization handles transport-layer credentials, not application-layer PII.
Choosing the right format for the report
The format you attach matters as much as the content.
- HAR file (full session) — the right answer for almost every API or network bug. Carries everything a developer needs without re-running the user's flow.
- Copy as cURL / Copy as fetch — right-click any request in Chrome for a one-liner the developer can paste straight into a terminal. Pair it with the HAR.
- Screenshot of the Network tab — a visual pointer to the offending row, not a substitute for the data. Annotate the failing request before attaching.
- Raw response body — useful when the bug is the response itself (broken JSON, unexpected nulls). Paste as a code block, not a file attachment that won't preview.
.pcap(Wireshark) — only when the bug is below the HTTP layer. Most application developers will bounce a pcap asking for a HAR.
A common mistake is attaching three screenshots and no HAR. Always include the raw data, and use screenshots to point at it.
Where to attach network logs in your tracker
The mechanics differ slightly by tool.
- Jira — drag the
.harinto the Attachments panel. Jira indexes attachment filenames but not contents; name the filebug-1234-har-2026-05-22.harso it's findable later. Use a comment under the attachment for the pointer line. - Linear — paste the file into the description or a comment. Linear renders the attachment chip inline.
- GitHub Issues — drag the file into the editor. GitHub rejects
.harfiles over 25 MB; for those, link a private Gist or trim the HAR before export. - ClickUp — Attachments tab. The preview won't render HAR contents, so include the pointer line in the description.
- Slack — fine for fast internal sharing, never for an external vendor's public help channel. Slack retention varies by workspace and DLP scans rarely catch JSON-embedded tokens.
Whatever the tracker, the message that ships with the HAR determines whether the developer fixes the bug today or asks a clarifying question tomorrow. The template that works is short:
Failing request:
POST /api/ordersStatus:422 Unprocessable EntityReproduced at:2026-05-22T14:32:07ZUser role:vendor_adminBrowser/OS:Chrome 138, macOS 14.5HAR attached, single failing request highlighted in the file.
That block costs 30 seconds to write and saves the developer a full triage cycle.
For more on writing reports that get acted on, the perfect bug report template walks through the structure.
Common scenarios where network logs settle the question
A few patterns where pulling a HAR ends an otherwise circular conversation.
401 Unauthorized that shouldn't be happening. Filter Fetch/XHR for status-code:4, find the 401, check the Authorization header, then look one or two requests earlier for a token-refresh call. Often, the failed refresh is the actual bug and the 401 is a downstream symptom.
CORS error blocking a fetch. The console shows the friendly message; the Network tab shows the truth. Find the preflight OPTIONS request — its response headers determine whether the actual request will even fire. If Access-Control-Allow-Origin is missing or doesn't match, the fix is server-side, every time.
Silent form submission failure. Filter Fetch/XHR, find the submission request, check the status and response body. A 422 with email_invalid and no UI message means the error came back and the frontend ignored it.
Unexpectedly stale data. A 304 Not Modified with an ETag validator means the browser served from cache; a 200 OK means it didn't, and the bug is in how the server responded. Same symptom, opposite fix.
For the broader discipline this fits into, the 10 SQA methodologies guide covers how network-log work slots into a working QA process.
FAQ
What is a HAR file?
A HAR (HTTP Archive) file is a JSON document, defined by the W3C, that records every HTTP request and response a browser made during a session — including headers, payload, timing, and initiator. Every major browser can export one, and most network debugging tools can read one.
Are HAR files safe to share publicly?
Not by default. Even sanitized HAR exports can contain PII inside response bodies, internal URLs, and application-level secrets. Treat them as private artifacts, redact before sharing externally, and prefer the sanitized export when in doubt.
How do I capture network logs on iOS Safari?
Turn on Web Inspector in Settings > Apps > Safari > Advanced on the iOS device, connect it to a Mac by USB, and open the device from the desktop Safari's Develop menu. The Web Inspector that opens has a full Network panel with HAR export.
Charles Proxy vs Wireshark — which should I use?
Charles Proxy for HTTP/HTTPS application debugging on native mobile or desktop apps, especially when you need to modify responses. Wireshark only when the bug is below the HTTP layer — DNS resolution, TLS handshake failures, raw TCP issues. They solve different problems; teams that ship web and mobile apps mostly need Charles (or Proxyman) and rarely touch Wireshark.
Does a HAR file contain my session cookie?
It depends on the export. Chrome 130+ defaults to sanitized HAR which strips Cookie, Set-Cookie, and Authorization headers. Firefox does not sanitize by default. Always check the file in a JSON editor before sharing externally.
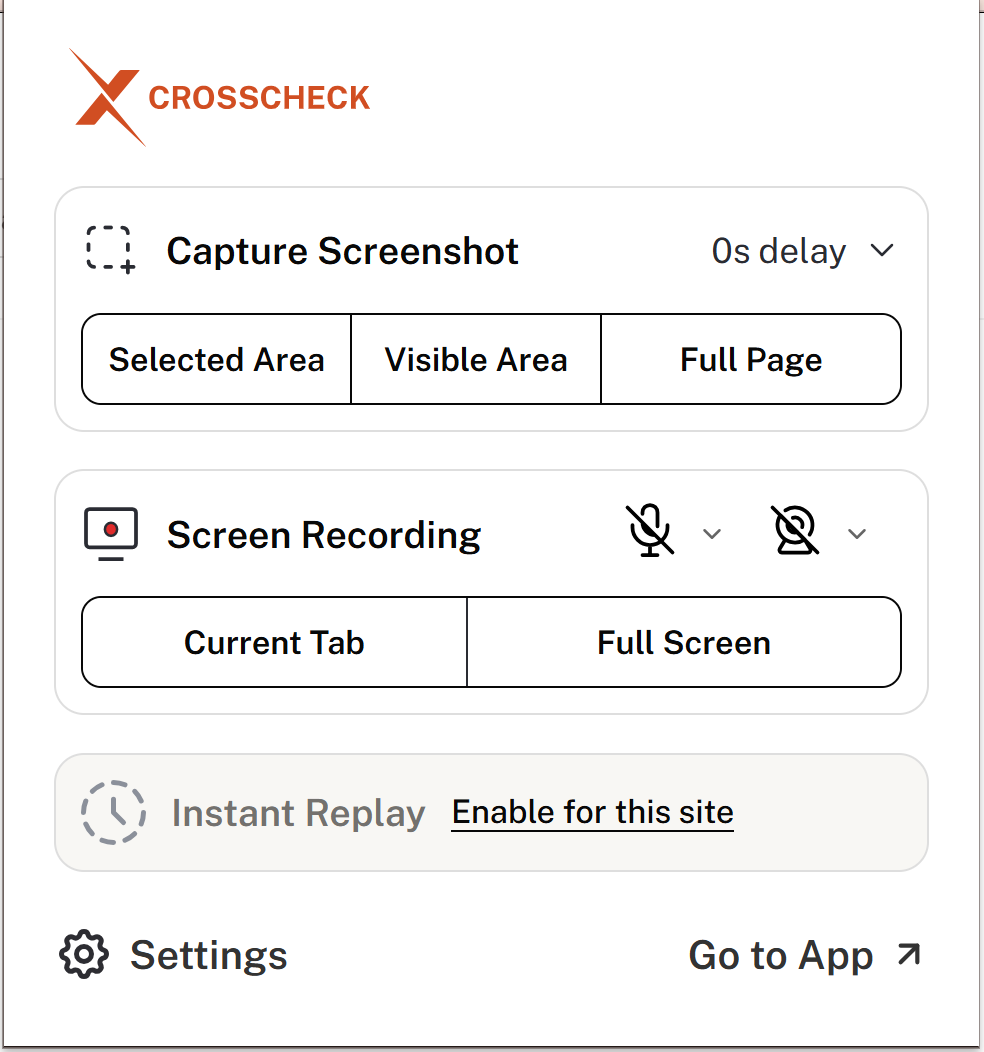
Capture and attach network logs without the export-and-redact dance
The workflow above is the right one to know — but in practice, a QA engineer filing six bugs a day does not want to run Cmd+R, reproduce, export, redact, attach, and write a pointer line six times. Crosscheck is the Chrome extension built for exactly that gap. Hit the capture shortcut, reproduce the bug, and Crosscheck bundles a screenshot or screen recording with every network request the page made — URL, method, status, headers, timing — alongside the console log, browser metadata, and a written description, then files the whole package to Jira, Linear, ClickUp, GitHub, or Slack.
There is no separate HAR to export and no sanitization toggle to remember. The reporter never needs to know what the Preserve log checkbox does, and the developer receiving the report sees the same network detail they'd get from a hands-on DevTools session.