How to Use Chrome DevTools: A Complete Walkthrough for QA and Developers
Chrome DevTools is the in-browser debugger and inspector built into every Chrome installation — twelve panels covering DOM, JavaScript, network, storage, performance, accessibility, and (since Chrome 132) AI-assisted analysis across most of them. For developers it is a daily companion. For QA, it is the surface where vague bug reports become reproducible ones, because almost every visible failure leaves a trace in either the Console or the Network panel, and DevTools is where those traces live.
This Chrome DevTools tutorial walks each major panel in the order a QA engineer or developer actually touches them during a real investigation — what they do, what changed in 2025-2026, and the specific techniques that move you from "the page looks broken" to a bug report a developer can act on the same hour.
Key takeaways
- DevTools is twelve panels, but most bugs surface in three. Console (errors), Network (failed requests), and Application (storage state) account for the vast majority of reproducible defects.
- AI assistance now spans the Console, Sources, Network, Styles, and Performance panels since Chrome 132, with Lighthouse data and reasoning widgets added at Google I/O 2026.
- The Performance panel's Insights sidebar breaks down LCP and INP into phases, surfaces forced reflow, and highlights render-blocking requests — much of what used to require Lighthouse round-trips is now inline.
- The Recorder panel has matured into a real test-authoring entry point, exporting Puppeteer, Playwright, JSON, and third-party formats including Cypress, Nightwatch, and Sauce Labs.
- DevTools captures what you ask it to capture. Console errors that fired before you opened the panel are gone. That gap is what tools like Crosscheck exist to close.
Opening DevTools and choosing a layout
Three reliable ways to open Chrome DevTools — F12 on Windows and Linux, Cmd + Option + I on macOS, or right-click and choose Inspect. The Command Menu (Cmd/Ctrl + Shift + P) is the fourth, less obvious one: it lets you fuzzy-search any DevTools feature by name, including features buried two menus deep.
Docking matters more than people assume. For QA work, docking DevTools to the right of the viewport keeps the application visible while Network and Console stream live. For performance recording, undocking into a separate window stops DevTools from competing with the page for layout time and produces cleaner traces.
The Elements panel: DOM, styles, and the truth about state
The Elements panel shows the live DOM — the parsed and rendered HTML, including everything JavaScript has changed since page load. It is the panel where "the UI says one thing, the markup says another" gets resolved. Developers use it to inspect and edit HTML in place, test CSS without touching source files, and walk the Styles cascade to see where a property came from.
For QA, three techniques carry most of the weight.
Force element state. In the Styles pane, click the :hov button to toggle :hover, :focus, :focus-visible, :focus-within, :active, and :visited on any selected element. This is how you test hover-only styling without juggling a mouse position, and how you verify focus rings on keyboard-navigable controls.
Read ARIA attributes in the Accessibility pane. The Accessibility tab in the right-hand pane shows the computed accessible name, role, and ARIA tree for a selected node. Missing labels, incorrect roles, and broken aria-expanded toggles surface here long before they show up in an Axe scan.
Edit text and attributes in place. Double-click any text node or attribute to edit it directly — the cheapest way to test how a layout responds to long strings, RTL text, or unexpected characters without filing a content-change ticket.
The Computed tab is what you open when a layout bug is hard to explain. It shows the final resolved value of every CSS property after inheritance and specificity — which usually reveals exactly which rule the browser actually applied versus which one the designer thought was applying.
The Console: errors, evidence, and $0
The Console is the highest-signal panel in DevTools for QA. JavaScript errors, unhandled promise rejections, network failures, mixed-content warnings, CSP violations, and explicit console.log calls from application code all surface here. A bug report missing its Console output is a bug report that wastes the first hour of the developer's investigation.
Power tips for QA
Filter by level before you investigate. The level dropdown filters by Error, Warning, Info, or Verbose. When testing a specific workflow, filter to Errors only to cut the noise from third-party scripts that log warnings on every page.
Use the $0 reference. The last element selected in the Elements panel is available as $0 in the Console. Type $0.disabled to confirm whether that button is actually disabled, $0.getBoundingClientRect() to read its position, or $0.click() to fire its click handler programmatically. $1 through $4 reference the previous four selections.
Monitor events with monitorEvents(). Run monitorEvents($0, 'click') to log every click event on the selected element to the Console. monitorEvents($0) with no event type logs every event the element receives — useful when a control isn't responding and you need to confirm whether the event is being dispatched at all. unmonitorEvents($0) stops the stream.
Use Console Insights for unfamiliar errors. From Chrome 125 onward, hovering over a Console error reveals an Understand this error button. It sends the error, network data, and surrounding source to Gemini and returns an explanation in plain English. As of Chrome 132 the same AI assistance covers Styles, Sources, Network, and Performance — the integration has moved well past the Console.
Watch for uncaught promise rejections. Async failures often don't crash the UI; they just produce silent breakages — a save button that appears to work but nothing persists, a search that returns no results. Unhandled promise rejections show up in the Console with a yellow warning triangle. The Console is also where Content Security Policy violations land — the first place to look when a script suddenly stops loading in a hardened environment.
The Network panel: where most "frontend bugs" turn out to live
The Network panel records every HTTP request the page makes — HTML, CSS, JavaScript, images, fonts, XHR/Fetch API calls, WebSocket frames, server-sent events. For QA, this is the most consequential panel. A surprisingly high share of bugs that look like UI failures are actually backend or contract failures that the UI surfaced badly, and the Network panel is where that distinction gets made.
The filter bar accepts both pre-built type filters (Fetch/XHR, JS, CSS, Img, Font, Doc, WS, Manifest) and free-text operators most engineers never use: status-code:500 shows only server errors, larger-than:1M surfaces oversized assets, method:POST filters to mutations, and -domain:cdn.example.com excludes a noisy CDN entirely. Operators stack.
Preserve log across navigations. By default, the Network panel clears on navigation. Check Preserve log in the toolbar to retain the full history across reloads and redirects — non-negotiable when testing multi-step flows, OAuth handshakes, or anything that bounces through more than one URL.
Inspect the full request and response triplet. Click any request to open Headers, Payload, Preview, Response, and Timing tabs. The Response tab usually contains the server-side error message that the UI politely hid behind a generic "Something went wrong." Copy that response body into the bug report verbatim.
Read status codes as the first signal. A 200 succeeded. A 304 was cached. A 400 means the client sent the wrong shape. A 401 means the session expired. A 403 means the user lacks permission. A 429 means rate-limited. A 500 means the server broke. Each one points to a different team and a different fix.
Throttle the connection. The throttling dropdown ships with Slow 3G, Fast 3G, Slow 4G, Fast 4G, and Offline presets, plus custom profiles. Most loading-state, timeout, and error-handling bugs only reproduce under degraded conditions.
Copy as cURL. Right-click any request → Copy → Copy as cURL produces a terminal-ready command that reproduces the request exactly, headers and cookies included. It is the fastest way to hand a failing call to a backend engineer or replay it in Postman, Bruno, or Insomnia. Copy as fetch gives you a Fetch API call to paste into the Console for in-browser replay. Replay XHR re-issues a request without reloading — useful for distinguishing transient from deterministic failures.
The Sources panel: breakpoints, blackboxing, and overrides
The Sources panel is primarily a developer tool — a full JavaScript debugger with file navigation, breakpoints, step-through execution, scope inspection, and a watch panel. QA engineers don't need to live in it, but a handful of its features are worth borrowing.
Conditional breakpoints. Right-click any line gutter in the Sources panel and choose Add conditional breakpoint. The breakpoint pauses execution only when the expression evaluates truthy — for example, userId === 12345 to catch a bug that only appears for one account. Logpoints (in the same menu) log a message to the Console instead of pausing, without modifying source.
Blackboxing third-party scripts. Right-click any file in the Sources tree and choose Add script to ignore list to skip over framework and library code when stepping through. The default ignore list now covers well-known polyfills and bundler output, so a step-in jumps to your own code rather than into Webpack's runtime.
Local Overrides. Open the Overrides tab in the Sources panel, point it at a local folder, and DevTools will serve modified versions of any file you edit — JavaScript, CSS, HTML, JSON. This lets QA validate a proposed fix without waiting for a deployment: edit the file, reload, confirm the bug is gone, then file the report with confidence that the fix actually addresses the root cause.
Snippets. The Snippets tab stores reusable JavaScript that runs on any origin. Useful for QA libraries — a snippet that fills a form with valid test data, one that toggles a feature flag, one that dumps the application's Redux state to the Console. Snippets persist across sessions and survive browser updates.
The Performance panel: insights, INP, and what actually causes jank
The Performance panel records a frame-by-frame timeline of the browser's work — JavaScript execution, style and layout, paint, composite, network events, and Long Animation Frames. The 2025-2026 rebuild added an Insights sidebar that turns the panel from a raw trace viewer into something closer to a guided diagnostic tool.
Live metrics, then a trace
When you open Performance, the panel immediately captures live Core Web Vitals for the current page — LCP, CLS, and (after you interact) INP — alongside their pass/fail thresholds. Use this to confirm a regression exists before recording a full trace.
The Insights sidebar
After recording a trace, the Insights sidebar lists the issues DevTools detected — and it is the closest DevTools has come to telling you what to fix, rather than what happened.
- LCP by phase breaks Largest Contentful Paint into four subparts: TTFB, resource load delay, resource load duration, and element render delay. Each subpart links back to the trace. This is the single most useful starting point for any LCP regression, because the right fix differs depending on which subpart dominates.
- LCP request discovery flags when the LCP image was lazy-loaded, when
fetchpriority="high"is missing, or when the resource isn't discoverable from the HTML. - INP by phase does the same thing for Interaction to Next Paint — input delay, processing time, presentation delay — and overlays the breakdown on the trace so you can see which scripts blocked the main thread.
- Forced reflow alerts you to interleaved DOM reads and writes that force the browser to redo layout mid-frame.
- DOM size flags pages with node counts large enough to make every interaction expensive.
- Render-blocking requests highlights resources delaying the initial render.
According to HTTPArchive's 2026 data, INP is the Core Web Vital where most sites fail — roughly 65% of origins meet the threshold, compared with 80% for LCP. If you only learn one Performance workflow, learn the INP trace: record, expand the Interactions track, hover any interaction over 200 ms to see its input/processing/presentation breakdown, and follow the red-triangle markers.
AI assistance on traces
Since Chrome 132, AI assistance can answer questions about specific tasks in a recorded performance profile. Click a long task in the trace, open the AI assistance panel, and ask "why did this take 800 ms?" — the assistant uses a dedicated call-tree serializer (AiCallTree) to fit the relevant context into Gemini's window and respond with a reasoned answer. At Google I/O 2026, the integration gained Lighthouse data and reasoning widgets that show how the answer was constructed, which makes it auditable rather than a black box.
The Memory panel: heap snapshots and leak hunting
The Memory panel is where you go when an application slows down over time, the JavaScript heap grows without releasing, or a single-page app feels sluggish after a few hours of use. Three recording modes ship with it: Heap snapshot captures the full state of allocated objects at a moment in time, Allocation instrumentation on timeline records every allocation against a timeline, and Allocation sampling uses statistical sampling for low-overhead profiling of long-running sessions.
The standard leak-hunting workflow is the three-snapshot technique — take a snapshot, perform the action you suspect leaks (open a modal, navigate, and back), take a second snapshot, repeat the action, take a third. Filter the third snapshot to Objects allocated between snapshots 1 and 2 and look for objects that grew in count and stayed alive. Detached DOM nodes — elements no longer in the document but still held by JavaScript — are the most common culprit and appear with a distinct Detached prefix in the Class filter.
The Application panel: storage, cookies, and service workers
The Application panel exposes everything the browser is storing on the page's behalf — cookies, local storage, session storage, IndexedDB, Web SQL, cache storage, service worker registrations, manifests, background services. Storage-related bugs are some of the most subtle in web applications, and this panel is where you find them.
Cookies. Open Storage → Cookies → [origin] to see every cookie with its name, value, domain, path, expiry, size, HttpOnly, Secure, SameSite, and partition key. An auth cookie missing the Secure or HttpOnly flag in production is a finding worth flagging immediately. A SameSite=None cookie missing Secure is rejected silently in current Chrome and explains many "logged in on desktop, logged out in iframe" bugs.
Local and session storage. Many applications stash feature flags, user preferences, and partial form state in localStorage. Edit values directly in the table to test how the application behaves when the data is missing, malformed, or set to extremes.
Service workers. The Service Workers pane lets you see registered workers, force-update them, check their offline behavior, and bypass the cache. The Offline checkbox simulates a true network-offline state for testing PWA behavior — distinct from the Network panel's Offline throttle, which only affects the page itself.
Storage quotas and clear-site-data. Storage → Usage shows total storage usage per origin and includes a single Clear site data button that wipes everything for the origin — the cleanest way to test first-visit flows without creating a new browser profile.
Lighthouse, Security, and Recorder: three panels worth knowing
Lighthouse runs an automated audit and scores the page on Performance, Accessibility, Best Practices, SEO, and PWA criteria. It is the same engine that powers PageSpeed Insights. Use it as a sanity check after any release that touches loading behavior, not as the source of truth for accessibility — automated accessibility scans catch roughly 30-40% of real WCAG issues according to research from Deque and others, so Lighthouse passes do not equal accessible.
Security shows the origin's TLS certificate chain, certificate transparency status, and mixed-content warnings in one pane. Useful when an HTTPS page mysteriously shows as "not secure" — the actual reason is usually an asset loaded over plain HTTP from a third-party domain.
Recorder matured significantly in 2025-2026. It records user flows from the browser, replays them with optional network throttling and slow-motion playback, sets breakpoints inside replays, and exports recordings as JSON, Puppeteer, Puppeteer Replay, Puppeteer for Firefox, or Puppeteer with Lighthouse. Third-party export plugins extend the format list to Cypress, Nightwatch, CodeceptJS, TestCafe, and Sauce Labs. For QA teams without a dedicated codegen workflow, Recorder is the fastest path from "I can reproduce this manually" to "here is a script that reproduces it on every CI run."
Eight Chrome DevTools power tips for QA
Most of DevTools' real leverage lives in features that aren't discoverable from the panel chrome. The list below collects the ones that have outsized impact on QA day-to-day.
- Capture full-page screenshots from the Command Menu.
Cmd/Ctrl + Shift + Pthen type screenshot — options include full-page, node, and viewport screenshots. Far cleaner than OS-level screenshots and produces pixel-accurate evidence of the rendered DOM. - Use
copy()in the Console to put any object on the clipboard.copy(someObject)JSON-stringifies it and copies the result. Useful for capturing API responses, application state, or Redux store snapshots straight into a bug report. - Filter Console output by source. The Console filter bar accepts
url:filters —url:app.jsshows only logs from that file, hiding everything from third-party scripts. - Group requests by initiator in the Network panel. Right-click the request table header and group by Initiator to see which script triggered which network call — the fastest way to find runaway analytics or rogue polling.
- Open DevTools before the bug happens, not after. This is the single biggest behavior change that improves bug-report quality. Console errors and Network requests that fired before DevTools opened are not retrievable.
- Use Workspaces for persistent edits. Sources → Workspaces lets you map a local folder to a served origin so edits in DevTools save to disk. Combined with Local Overrides, this turns DevTools into a viable fix-and-verify environment.
- Throttle CPU as well as network. The Performance panel's CPU throttle (1x, 4x, 6x slowdown) catches jank that only appears on low-end devices. Pair with mobile network throttling for an honest field-conditions test.
- Run Lighthouse in incognito. Extensions inject scripts that distort Performance scores. Always run Lighthouse audits from an incognito window with no other extensions, and average three runs before treating any single score as signal.
A bug-investigation workflow that uses all of this
Knowing each panel is necessary but not sufficient. The workflow that turns DevTools into a defensible bug-reporting surface looks like this:
- Open DevTools and dock it to the right of the viewport. Pin the Console and Network panels in their respective drawers.
- Check Preserve log on the Network panel. Open the Network throttle dropdown and select the connection profile that matches the user's reported conditions, if known.
- Open the Application panel and note relevant cookies and storage values before reproducing.
- Reproduce the bug while watching Console and Network in real time.
- Capture Console output verbatim — full error message, file, line, stack trace. Use
copy()in the Console to grab any object you'd otherwise screenshot. - Identify the failing or unexpected network request. Note URL, method, status, request payload, response body. Right-click → Copy as cURL.
- Take a Command Menu full-page screenshot. Record a Performance trace if the bug is performance-related.
- Note environment: Chrome version (
chrome://version), OS, viewport size, and any browser flags you enabled.
A bug report containing the failing request with full response body, the associated Console error, the cURL reproduction command, and a screenshot is one a developer can act on the same hour. A bug report saying "the page broke" is one that gets deprioritized.
FAQ
How do I open Chrome DevTools quickly?
Use F12 on Windows and Linux, Cmd + Option + I on macOS, or right-click any element on the page and select Inspect. The Command Menu (Cmd/Ctrl + Shift + P) is the fastest way to reach any DevTools feature by name once the panel is open.
Which Chrome DevTools panel is most useful for QA?
For most bugs, the Console and Network panels together. Console surfaces JavaScript errors, unhandled promise rejections, and CSP violations. Network shows failing API calls, status codes, and response bodies. The Application panel covers storage- and cookie-related bugs, and the Elements panel covers DOM and accessibility issues.
What's new in Chrome DevTools in 2026?
The biggest change is the expansion of AI assistance — what started as Console Insights in 2024 now covers Console, Sources, Network, Styles, and Performance as of Chrome 132. Google I/O 2026 added Lighthouse integration into AI assistance, reasoning widgets that show how Gemini reached its conclusions, and Chrome DevTools for Agents (an MCP server that lets coding agents like Claude, Cursor, and Copilot drive a live DevTools session). The Performance panel's Insights sidebar has also matured significantly, with per-phase LCP and INP breakdowns.
How do I record and replay a user flow in DevTools?
Open the Recorder panel from the More Tools menu. Click Create a new recording, perform the user flow, then click End recording. The Recorder lets you replay with normal speed, slow speed, breakpoints, or step-through, and export the recording as JSON, Puppeteer, Puppeteer Replay, or third-party formats like Cypress and Nightwatch via export extensions.
What's the difference between the Performance panel and Lighthouse?
Lighthouse runs a single automated audit and scores the page on Performance, Accessibility, Best Practices, SEO, and PWA criteria — best for spotting regressions in CI. The Performance panel records an interactive trace of the browser's actual work over a window of time, and is where you investigate why a specific interaction was slow. Lighthouse tells you what to fix; the Performance panel tells you why.
Can DevTools test accessibility?
Partially. The Accessibility pane inside the Elements panel shows the computed accessible name, role, and ARIA tree. The Lighthouse audit runs Axe-core under the hood. Both are useful, but automated tools catch roughly 30-40% of WCAG issues according to multiple industry studies — they are a starting point, not a substitute for assistive-technology testing. See the best accessibility testing tools breakdown for the wider toolchain.
Where DevTools ends and a bug-reporting tool begins
DevTools is the deepest investigation surface a tester or developer has, but it depends on a specific condition: you opened it before the bug happened. Console errors that fired before the panel was visible are gone. Network requests from earlier in the session aren't preserved unless Preserve log was already on. The session leading up to a failure — the exact clicks, the order, the prior page state — is not something DevTools captures.
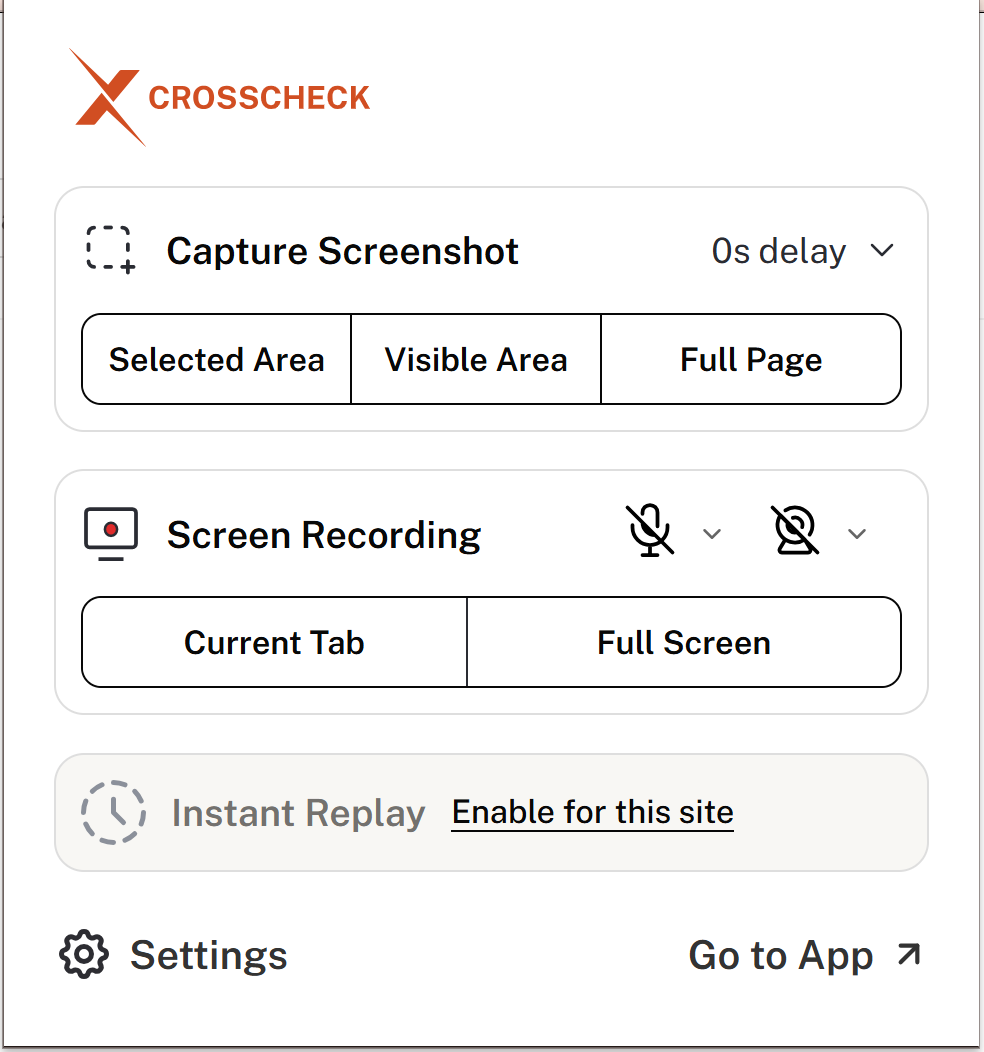
Crosscheck closes that gap. It's a free Chrome extension that records console logs, network requests, screenshots, and screen recordings in the background, then bundles all of it into a single bug report sent straight to Jira, Linear, ClickUp, GitHub, or Slack when you click Report Bug. The technical context — the same evidence a thorough DevTools session would produce — is captured automatically, including the steps that led up to the failure rather than just the moment of it.
DevTools and Crosscheck are not alternatives. DevTools is where you go to understand a bug; Crosscheck is what makes sure the bug you understood is communicated with enough evidence that the developer doesn't have to reproduce it from scratch. For teams trying to reduce bug-reproduction time without rebuilding their tooling stack, the combination is the shortest path. Pair it with a perfect bug report template and the median time from "tester found something" to "engineer has a fix in flight" drops noticeably across most teams that adopt the workflow.