How to Send Bug Reports to Jira Automatically — Without the 15-Minute Ticket Tax
To send bug reports to Jira automatically, you have four production paths in 2026: a direct POST to the Jira Cloud REST API v3 /rest/api/3/issue endpoint, a capture tool (Crosscheck, Marker.io, Jam) that pushes structured tickets via OAuth 2.0 (3LO), an error-monitoring service like Sentry that creates issues from alert rules, or an email-to-Jira gateway. The right choice depends on who is filing — a developer, a QA tester, an end user, or an automated monitor — and how much technical context the ticket needs to carry.
This guide covers all four with the REST payload that works, a Node.js script you can drop in today, the OAuth scope you need, and the custom-field trap that breaks most first integrations.
TL;DR
- REST API v3 uses Atlassian Document Format (ADF) for descriptions — plain strings are rejected. Endpoint:
POST /rest/api/3/issue. - Auth in 2026: Basic + scoped API token for back-end scripts, OAuth 2.0 (3LO) with
write:jira-workfor user-context apps. Classic unscoped tokens are being phased out for JPD GraphQL on November 1, 2026. - Capture tools (Crosscheck, Marker.io, Jam) handle the API plumbing and attach the technical context (console, network, video) that hand-written tickets always miss.
- Email-to-Jira still works for stakeholders who will not touch a widget — but loses everything below the screenshot.
- Custom fields use IDs, not names (e.g.
customfield_10010). The most common 400 error in Jira automation is sending field names.
The four ways to file a Jira bug automatically
Most teams need more than one path. A developer with a CLI wants a script. A QA tester wants a Chrome extension. A product manager wants a widget on staging. A support agent wants email.
| Path | Best for | Captures dev context? | Auth |
|---|---|---|---|
| REST API v3 (direct) | Developers, CI scripts, custom internal tools | Whatever you send | Basic + API token or OAuth 2.0 (3LO) |
| Browser extension (Crosscheck, Jam) | QA, engineers reproducing bugs | Yes — console, network, video, env | OAuth 2.0 |
| Visual widget (Marker.io, BugHerd) | Stakeholders, clients, content reviewers | Partial — screenshot, browser meta | OAuth 2.0 |
| Error monitor (Sentry) | Production runtime errors | Yes — stack trace, breadcrumbs | OAuth 2.0 |
| Email-to-Jira | Anyone with an inbox | No | None on reporter side |
Each writes to the same Jira backlog. The difference is how much context lands with each ticket — and that is where ticket quality is won or lost.
Why manual Jira reporting is the wrong default
Manual ticket creation is slow, but the harder problem is inconsistency. A QA engineer under release pressure writes "Checkout error — please investigate." A careful tester writes 400 words and attaches three screenshots, but takes twelve minutes per ticket and files four bugs a day instead of fifteen.
Studies of large open-source projects consistently find a meaningful share of reported bugs end up tagged "invalid" or "cannot reproduce" — almost always because the ticket was filed without the technical evidence needed to diagnose it. Each clarification round is a developer context switch. The cost is not the missing minutes — it is the multiplier on cycle time.
Manual workflows also fragment the feedback loop. The console logs, the failing POST /api/v1/orders, the user-action sequence — the things developers need — sit in a DevTools panel that was closed twenty minutes ago. Automation does not just make ticket creation faster. It changes what the ticket contains.
Path 1: The Jira Cloud REST API v3 — a working script
If you control the reporter (a CLI, a CI job, a custom browser extension your team built), the cleanest path is a direct POST. V3 is the current REST API version and the one you want — it supports the Atlassian Document Format (ADF) for rich content.
The endpoint is POST https://your-domain.atlassian.net/rest/api/3/issue. The payload is JSON. The description must be ADF, not a plain string — sending a string is the single most common reason first integrations return a 400.
Here is a working Node.js example using fetch (Node 24 has it built in):
// create-jira-bug.js
const JIRA_DOMAIN = process.env.JIRA_DOMAIN; // e.g. acme.atlassian.net
const JIRA_EMAIL = process.env.JIRA_EMAIL; // your Atlassian account email
const JIRA_TOKEN = process.env.JIRA_API_TOKEN; // scoped API token
const PROJECT_KEY = 'ENG';

const auth = Buffer.from(`${JIRA_EMAIL}:${JIRA_TOKEN}`).toString('base64');

async function createBug({
  summary,
  stepsToReproduce,
  consoleError,
  url,
  env,
}) {
  const body = {
    fields: {
      project: { key: PROJECT_KEY },
      summary, // ≤255 chars
      issuetype: { name: 'Bug' },
      priority: { name: 'Medium' },
      labels: ['auto-reported', 'browser-capture'],
      description: {
        // ADF — required in v3
        type: 'doc',
        version: 1,
        content: [
          {
            type: 'heading',
            attrs: { level: 3 },
            content: [{ type: 'text', text: 'Steps to reproduce' }],
          },
          {
            type: 'paragraph',
            content: [{ type: 'text', text: stepsToReproduce }],
          },
          {
            type: 'heading',
            attrs: { level: 3 },
            content: [{ type: 'text', text: 'Console error' }],
          },
          {
            type: 'codeBlock',
            attrs: { language: 'javascript' },
            content: [{ type: 'text', text: consoleError }],
          },
          {
            type: 'paragraph',
            content: [
              { type: 'text', text: 'URL: ' },
              {
                type: 'text',
                text: url,
                marks: [{ type: 'link', attrs: { href: url } }],
              },
            ],
          },
          {
            type: 'paragraph',
            content: [{ type: 'text', text: `Environment: ${env}` }],
          },
        ],
      },
      // Custom field — use the ID, not the display name
      customfield_10042: 'Production', // e.g. "Environment" dropdown
    },
  };

  const res = await fetch(`https://${JIRA_DOMAIN}/rest/api/3/issue`, {
    method: 'POST',
    headers: {
      Authorization: `Basic ${auth}`,
      Accept: 'application/json',
      'Content-Type': 'application/json',
    },
    body: JSON.stringify(body),
  });

  if (!res.ok) {
    const err = await res.text();
    throw new Error(`Jira ${res.status}: ${err}`);
  }
  return res.json(); // { id, key, self }
}

createBug({
  summary: 'Checkout fails silently after applying expired promo code',
  stepsToReproduce:
    '1. Add item to cart  2. Apply code SAVE20  3. Click Pay Now',
  consoleError:
    "TypeError: Cannot read properties of null (reading 'discount_amount') at checkout.js:342",
  url: 'https://app.example.com/checkout',
  env: 'Chrome 122, macOS 14.3, viewport 1440×900',
}).then(({ key }) => console.log(`Created ${key}`));
Two things catch you out on day one. Custom fields use IDs, not names — sending "Environment": "Production" returns 400 Bad Request: Field 'Environment' cannot be set. Open Project settings → Issues → Custom fields and copy the customfield_xxxxx ID, or call GET /rest/api/3/field once to cache the mapping. The description must be ADF — the Atlassian Document Format JSON tree shown above. Plain strings are a v2 thing.
To attach a screenshot or HAR file after creation, POST to /rest/api/3/issue/{issueKey}/attachments with multipart/form-data and the header X-Atlassian-Token: no-check.
Authentication in 2026: tokens, OAuth, and what is going away
The authentication landscape has tightened. The 2026 patterns:
- Basic auth with a scoped API token for back-end scripts. Generate at
id.atlassian.com → Security → API tokens, give it only the scopes it needs, rotate periodically. - OAuth 2.0 (3LO) for any app acting on behalf of a user — required for browser extensions, marketplace apps, and SaaS integrations. The scope for bug reporting is
write:jira-work(andread:jira-workif you also need project/issue type metadata). OAuth 2.0 uses short-lived rotating refresh tokens, materially safer than persistent API tokens. - Service accounts with scoped credentials for machine-to-machine flows where no human owns the integration.
Two deprecations to plan for: classic (unscoped) API tokens for Jira Product Discovery GraphQL stop working on November 1, 2026 — fine-grained scoped tokens are the replacement. The Atlassian Connect platform itself enters its final end-of-support phase in Q4 2026, so any integration on Connect Spring Boot or Connect Express needs a Forge migration plan. Practical takeaway: do not ship a new integration on unscoped Basic auth, and do not ship a marketplace app on Connect.
Path 2: Browser extensions that handle the API for you
The script above is fine for one tool and one project. It stops scaling the moment you have five reporters, three projects, and a different custom-field schema per board. Capture-and-push tools earn their keep here — they own the API contract, the OAuth dance, the field mapping UI, and the asset upload pipeline.
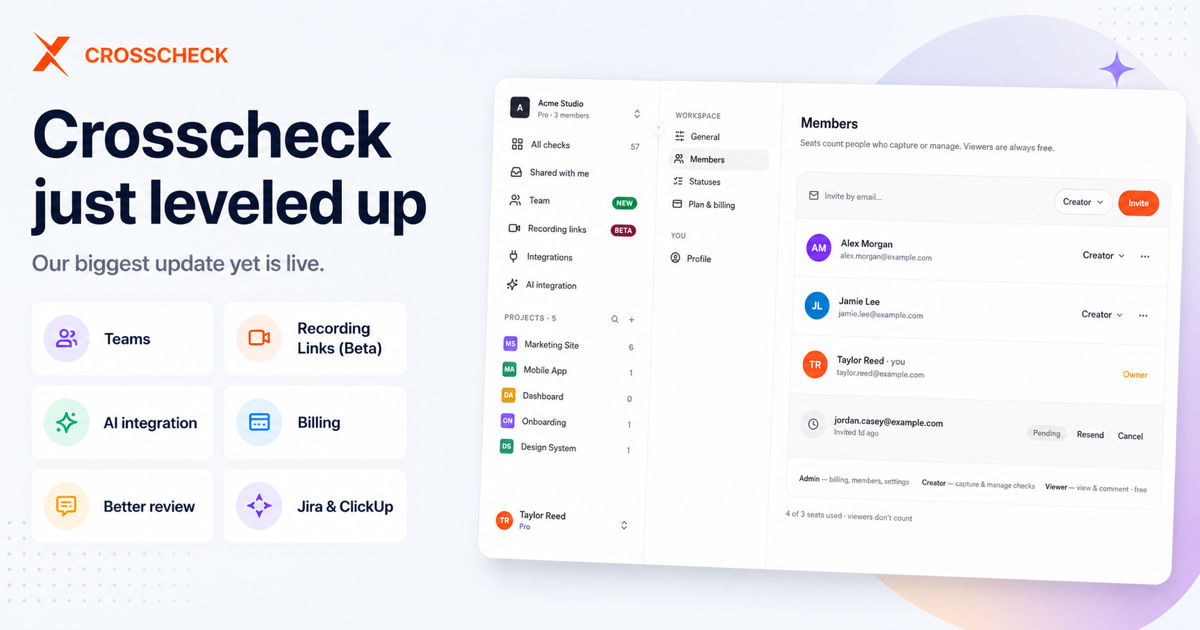
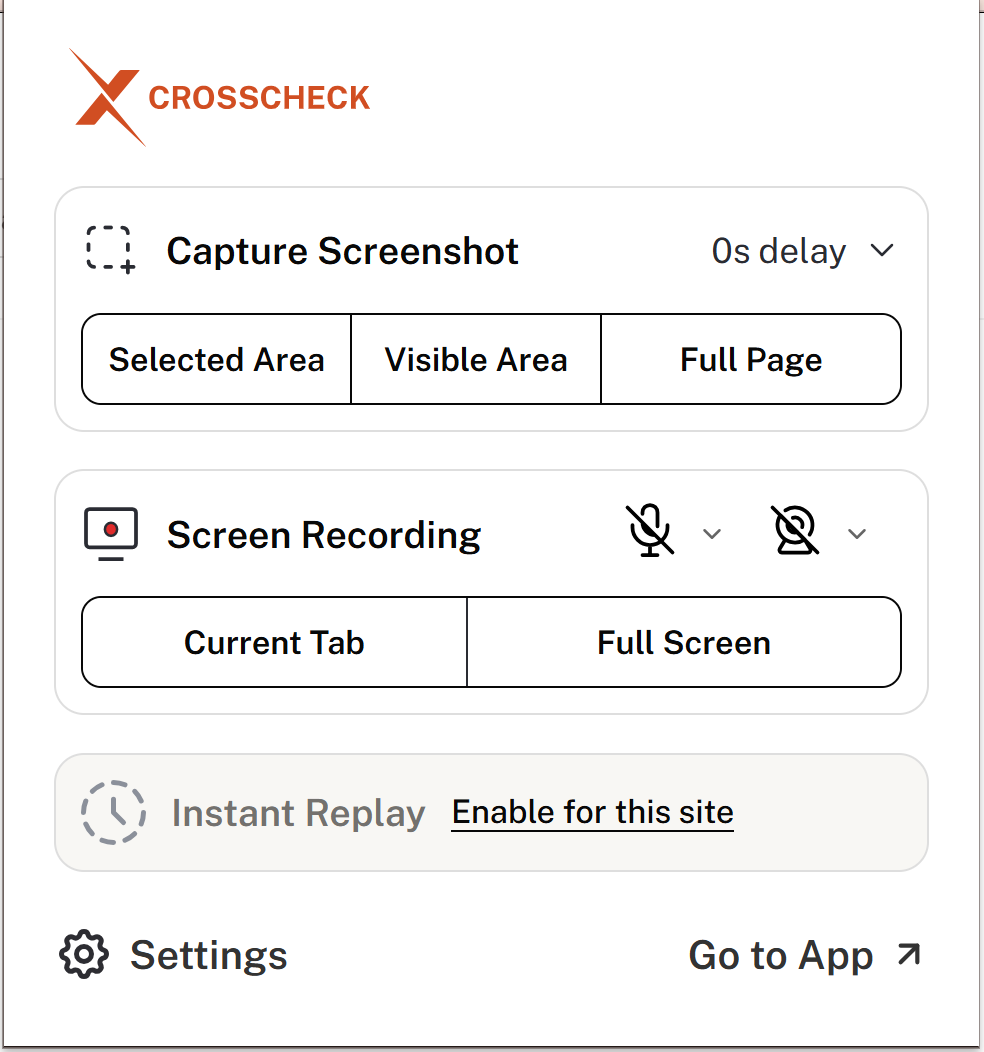
Crosscheck is a free Chrome extension that captures screenshots, screen recordings, and instant replays — a retroactive capture of the last 1–5 minutes of browser activity, recorded in the background — together with console logs, network requests with status codes, the URL, viewport, and a chronological user-action timeline. Select your Jira project and issue type, set priority, and the ticket lands in your board with every asset attached. Install from the Chrome Web Store, connect via OAuth (write:jira-work + read:jira-work), pick a default project. Multiple projects supported.
Instant Replay matters most for hard-to-reproduce bugs. Rather than trying to retrigger an intermittent issue, a reporter pulls the replay of what just happened — DOM state, network calls, console output included — and attaches it. The bug is documented even if it never recurs in the same way.
Two alternatives worth knowing. Jam offers similar capture (screenshot, video, console, network) and a Jira integration; direct issue creation with full context sits behind the paid tier, while the free tier produces shareable links. Marker.io is a visual widget that lives on the site rather than the toolbar — built for non-technical reporters (clients, marketers, content reviewers) with strong two-way Jira sync. Reporters get an email when their bug is closed, without needing a Jira seat. Technical context depth is narrower than a developer-focused extension.
Path 3: Sentry, Datadog, and error-monitor → Jira pipes
For runtime errors that happen in production — the bugs no human reporter ever saw — you want the monitoring tool itself to file the Jira ticket. Sentry, Datadog, Rollbar and similar services do this through their alert engines.
In Sentry, create an Issue Alert, pick the conditions (error count threshold, new issue type, regression on a previously resolved error), and choose Create a new Jira issue as the action. The alert fires, a Jira ticket is created in your configured project, and the two are linked bidirectionally. Resolving one resolves the other. Comments and assignees sync.
Two things to flag. Sentry's automatic Jira issue creation is gated to Business and Enterprise plans; manual issue creation from a Sentry event is available on Team and above. And the ticket Sentry creates is excellent for the stack trace and breadcrumbs but misses the user-side context (what was on screen, what they clicked). For that, teams pair Sentry with a widget like Marker.io that can pass sentrySession as custom data via the JS SDK — so a user-reported bug carries the Sentry session ID and a Sentry-detected error can be cross-referenced to a user report. The point is that user-reported and machine-detected bugs end up in the same backlog with enough cross-references that triage stops being archaeology.
Path 4: Email-to-Jira for the lowest-friction reporter
Not every reporter will install an extension or learn a widget. Support agents, beta testers, and external stakeholders often just want to forward an email. Jira's email handler accepts inbound mail and creates an issue from each message — subject becomes summary, body becomes description, attachments come through.
The lowest-context path of the four. No console log, no network trace, no recording — just text. Appropriate for triage queues where a human will read every ticket; inappropriate for anything actioned without conversation. Configure at Jira Settings → System → Incoming mail, point it at a dedicated inbox, and create a mail handler that maps senders to a project and issue type. Most teams pair this with an automation rule that auto-applies a triage label.
Custom field mapping — the trap every team hits
The single biggest source of failed Jira automation is custom-field assumptions. Three rules that save a day of debugging. Reference custom fields by customfield_xxxxx ID, never display name — names are not unique across projects and the API treats them as such. Select-field values are objects, not strings: a single-select dropdown takes { "value": "Production" } or { "id": "10001" }; multi-selects take an array of those. Required fields differ per issue type per project — call GET /rest/api/3/issue/createmeta?projectKeys=ENG&issuetypeNames=Bug once during setup to discover what the target actually requires. Hard-coding fields that exist in one project but not another is how integrations silently break six months in.
For webhooks in the other direction — Jira firing to your service when a bug is created or transitioned — incoming webhook triggers now require a security token passed as X-Automation-Webhook-Token. Atlassian rolled this out in 2025 and decommissioned the legacy endpoint on May 30, 2025; anything older than that needs the new URL.
Comparing the capture tools that integrate with Jira
For teams whose goal is to land developer-ready bug reports in Jira from a real human's session, the comparison narrows to four tools.
| Tool | Capture depth | Jira integration | Best for | Pricing |
|---|---|---|---|---|
| Crosscheck | Screenshot, video, instant replay, console, network, user actions, env | Native OAuth, direct push with attachments | QA + engineering teams reproducing bugs | Free |
| Jam | Screenshot, video, console, network | Native; structured push on paid tiers | Engineering teams, internal bug filing | Free + paid |
| Marker.io | Screenshot, browser meta, console, network | Native, two-way sync, no Jira seat needed for reporter | Client/stakeholder feedback, agencies | Paid |
| BugHerd | Screenshot, browser meta, page context | Native, two-way sync | Agencies, content review workflows | Paid |
Crosscheck is the most natural fit for the QA-engineer-finding-a-bug workflow — purpose-built around making the resulting ticket complete enough that no clarification round is needed. Marker.io is the right answer when the reporter is a non-technical stakeholder who should not need a Jira account. Sentry sits alongside any of these, handling the production-error side of the same backlog.
Designing the workflow end-to-end
A QA team that has stopped writing Jira tickets by hand typically ends up with a stack like this: Crosscheck in every engineer's and tester's Chrome for bugs found during exploratory testing and dev; Sentry or Datadog creating Jira tickets from production error spikes; Marker.io on the staging site for product, design, and external reviewers; a small in-house script (close to the one above) for the edge cases — CI smoke-test regressions, security scanner findings — where the team wants total control over the payload; and email-to-Jira as a fallback inbox for support escalations.
The win is not any one tool. It is that the manual reporter is no longer the bottleneck. Every path into the Jira backlog arrives pre-structured, with enough technical context for a developer to start work without asking a single question. For what makes a ticket usable once it lands, see the perfect bug report template. For the wider tooling landscape, see the 2026 bug reporting tools roundup.
FAQ
Does the Jira REST API accept markdown in the description field?
Not in v3. The field requires the Atlassian Document Format (ADF), a JSON tree of typed nodes. V2 accepts wiki-style markup as a plain string, but v3 is the supported version. Open-source converters translate markdown to ADF if you have existing templates.
What OAuth scope do I need to create Jira issues?
write:jira-work covers issue creation. Add read:jira-work if your app also needs project metadata, issue types, or custom field definitions — most do.
Can I send bug reports to Jira from Zapier or Make without writing code?
Yes — both wrap the create-issue endpoint. Fine for low-volume, low-context tickets (a form submission becoming a Jira issue). Not the right tool when you need to attach console logs, video, and HAR files, because their plumbing is not designed for binary asset upload at scale.
How do I attach a screenshot or video to a Jira issue via the API?
Create the issue, then POST to /rest/api/3/issue/{issueKey}/attachments with multipart/form-data and the header X-Atlassian-Token: no-check. Form field name must be file. Multiple files per request supported.
Will classic Jira API tokens stop working in 2026?
Classic unscoped API tokens stop working for Jira Product Discovery GraphQL queries on November 1, 2026 — fine-grained scoped tokens are the replacement. Classic tokens for the REST API continue to function but are no longer the recommended pattern.
Send bugs to Jira from your browser today
The shortest path from "I found a bug" to "the developer has everything they need" is a Chrome extension that captures the technical context and pushes a structured ticket to Jira automatically. That is what Crosscheck does — screenshot, video, instant replay, console, network, and user-action timeline, attached to a Jira issue in one click. Free, no usage limits.