The Best Chrome Extensions for Developers in 2026
The best Chrome extensions for developers in 2026 fall into four working categories — debugging (Crosscheck, React DevTools, Vue DevTools, Apollo Client Devtools, Redux DevTools), inspection (axe DevTools, Wappalyzer, ColorZilla, JSON Viewer), productivity (Octotree, Refined GitHub), and AI assistance (GitHub Copilot, ChatGPT-side panel extensions). Each one earns its place by removing a step that DevTools alone makes slower — and every tool below has been verified active on the Chrome Web Store as of May 2026.
The browser is still where the bulk of front-end work gets diagnosed. With Manifest V3 now the only accepted format and several of the most-installed 2024 extensions having been delisted after the late-2024 supply-chain incidents, the shortlist worth installing has narrowed — and matured. The picks below are the ones that have survived that filtering.
TL;DR — the 2026 shortlist
- Debugging: Crosscheck for visual bug reports with logs, React DevTools 7.0.1 for React 19 hooks, Vue DevTools v7 for Vue 3, Apollo Client Devtools for GraphQL cache inspection, Redux DevTools for time-travel state debugging.
- Inspection: axe DevTools for WCAG 2.2 accessibility checks, Wappalyzer for tech-stack fingerprinting, ColorZilla for pixel-accurate color picking, JSON Viewer for readable API responses.
- Productivity: Octotree (or its free alternative Gitako) for GitHub file-tree navigation, Refined GitHub for 200+ small interface fixes.
- AI assistance: GitHub Copilot's browser surface area through the official GitHub extension, plus a ChatGPT side-panel extension for inline answers without tab-switching.
The list is intentionally short. A developer who installs every "useful" extension ends up with a browser that loads slowly and a permissions surface that is hard to audit — neither of which is good for productivity.
Why this list is shorter than most
Most "best Chrome extensions for developers 2026" articles run to 30 or 40 picks. That is rarely useful. Three constraints have narrowed what is worth installing today.
Manifest V2 deprecation completed in mid-2024, which quietly filtered out a long tail of abandoned tools — the Web Store listings that survive in 2026 are, on the whole, ones whose maintainers still ship. The December 2024 supply-chain incidents, in which compromised extensions exfiltrated data from an estimated 2.6 million users, made permission scrutiny non-optional. And Chrome DevTools itself has absorbed enough — Lighthouse, performance insights, the recorder — that many single-purpose 2022-era extensions are simply redundant now.
What follows is grouped by what each extension is for, not by ranking, because the right answer depends on the stack a developer works in.
Debugging extensions — what runs while you are fixing things
1. Crosscheck — bug reports with the technical context already attached
Chrome Web Store: Crosscheck
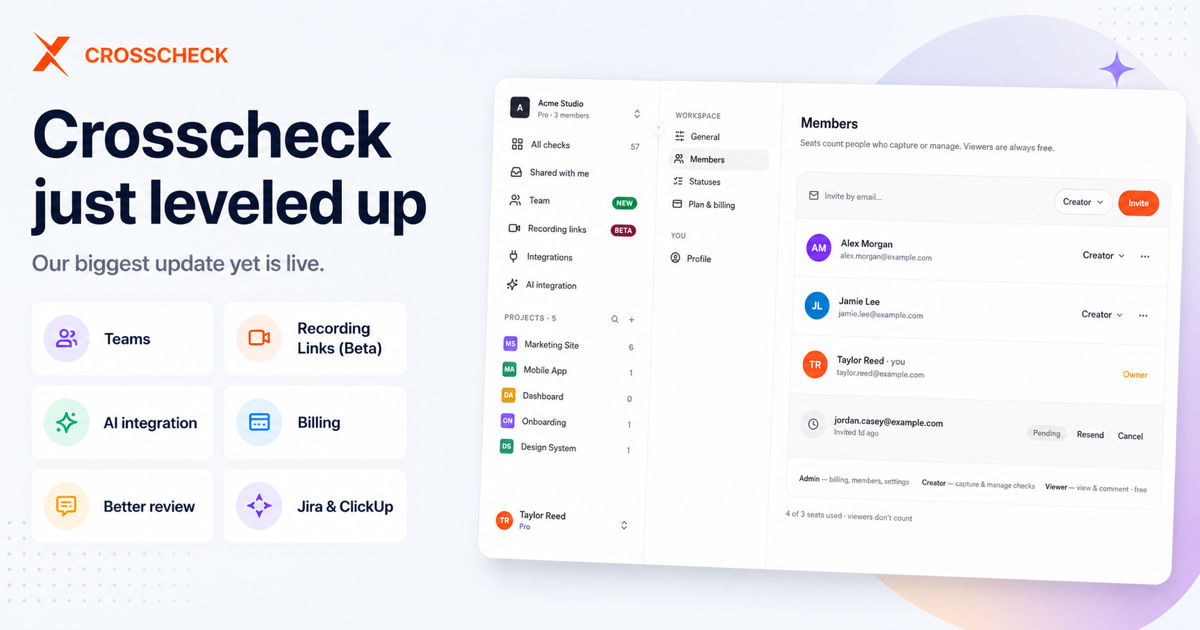
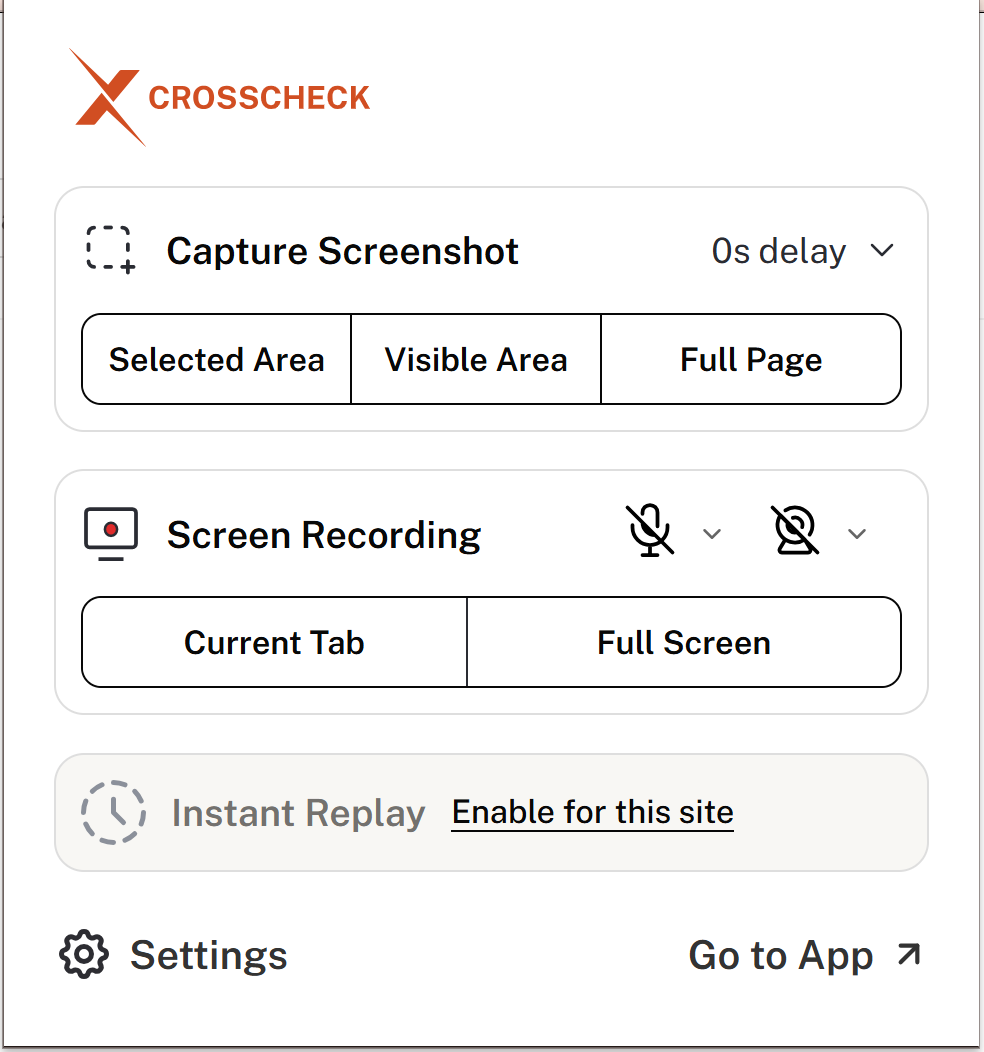
Most bug reports arrive without a console log, without a network trace, and without the steps that produced them — so the engineer's first hour is spent reproducing the bug rather than fixing it. Crosscheck is a free Chrome extension built to close that gap.
When a bug is hit, Crosscheck captures the screenshot or screen recording alongside the console logs, network requests and responses, the sequence of user actions taken, and the environment metadata (URL, OS, browser version, viewport). The report then goes straight into Jira, Linear, ClickUp, GitHub, or Slack as a structured ticket — no manual paste, no copy-edit pass.
- Auto-captured console and network data for every error, warning, and HTTP request around the bug.
- Action replay — a chronological trace of clicks, scrolls, inputs, and navigations that preceded the issue.
- Screen recording with annotation for bugs that take more than one screenshot to explain.
- Direct issue-tracker handoff — the bug lands as a properly formed Jira / Linear / ClickUp / GitHub issue with attachments populated.
Crosscheck is free, has no paid tier, and is built around the bug-report step — not test orchestration. See the perfect bug report template for the format it produces.
Best for: QA engineers, developers doing self-QA, designers and PMs filing bugs against staging.
2. React Developer Tools — required if you ship React
Chrome Web Store: React Developer Tools
Maintained by Meta and published by the React team itself. Version 7.0.1 shipped on October 20, 2025 and is the current build in 2026, with around five million users and full React 19 support.
The 7.x line added inspection for React 19's newer hooks — useActionState, useOptimistic, useFormStatus, and use — plus first-class support for Server Components in the component tree, including a clearer indication of why a component is suspended waiting on data. The Profiler tab continues to be the fastest way to spot a component re-rendering twenty times when it should be rendering once.
- Components panel — full React tree, with live editing of props and state.
- Hook inspection — values of every hook on a selected component, including the React 19 additions.
- Profiler with flamegraph — measure render cost and identify wasted renders.
- No remote telemetry — fully open source, source on the React repo.
If you write React, this is not optional — it is part of the default install. For teams choosing between React, Vue, and Svelte for a new project, our test-automation framework breakdown covers how the stack choice ripples downstream.
3. Vue DevTools — Vue 3 inspection, with a Vue-3-built rewrite in beta
Chrome Web Store: Vue.js devtools and Vue.js devtools (beta)
The official Vue DevTools split into two channels somewhere along the 7.x line. The stable v7 build supports Vue 3 only — if any of your apps are still on Vue 2, you need the older v6 listing. The beta channel is a full rewrite of the DevTools UI itself using Vue 3, and is the path the project is moving toward.
The browser extension is now one of three surfaces — the others being a Vite plugin and a standalone Electron app — which means a Vue developer can inspect from inside their IDE during development and inside Chrome during testing without conceptual context switching.
- Component inspector — props, data, computed, refs, with editable values.
- Pinia and Vuex panels — state stores including time-travel through mutations.
- Router and event timelines — for tracing navigation and emitted events.
- Pages, components, and pinia panels in the v7 redesign, with theme support.
The stable and beta extensions can conflict when both are enabled — if the Vue icon lights up but the panel does not show, disable one and reload.
4. Apollo Client Devtools — for GraphQL teams on Apollo
Chrome Web Store: Apollo Client Devtools
Apollo's official DevTools extension is the standard inspector for any application using @apollo/client. It adds an "Apollo" tab to Chrome DevTools with four panels — Explorer for running queries against the app's network layer, Watched Query Inspector for active queries with their variables and cached results, Mutation Inspector for fired mutations, and Cache Inspector for browsing and searching the normalized cache by field name or value.
It is open source, maintained by Apollo Graph, and the Firefox listing has been updated within the last month — so the project is active. Reviews note that the extension can be temperamental on newer Apollo Client releases, which is worth flagging: if it refuses to attach, the workaround is usually setting connectToDevTools: true explicitly on the ApolloClient constructor.
An emerging alternative is the VSCode-embedded variant, @apollo/client-devtools-vscode, which lets you debug a React Native or Node Apollo client remotely from your editor — useful when the bug is not in a browser at all.
5. Redux DevTools — time-travel debugging for state-heavy apps
Chrome Web Store: Redux DevTools
For applications using Redux — including the now-standard @reduxjs/toolkit setup — Redux DevTools turns state debugging from guesswork into a precise, replayable record.
Every dispatched action shows in a chronological list with its payload and the full state snapshot it produced. Step backward and forward through that list and the application UI replays the exact state at that moment. For a bug that only reproduces after a long sequence of actions, this is the difference between an afternoon and ten minutes.
- Action history with diffs that highlight exactly which keys changed.
- State persistence through
persistState()so a debugging session survives a reload. - Toolkit integration — works without configuration on a standard
configureStore()setup. - Multiple surfaces — Chrome extension, standalone Electron app, or embedded React component.
If you do not use Redux, skip this. If you do, it is essential.
Inspection extensions — what you reach for during review
6. axe DevTools — accessibility scanning that catches around half of WCAG issues automatically
Chrome Web Store: axe DevTools - Web Accessibility Testing
Deque's axe-core is the engine underneath Lighthouse, Microsoft Accessibility Insights, Pa11y, and dozens of other accessibility tools — it has been downloaded more than three billion times as an npm package. The browser extension is the same engine packaged for one-click scans inside Chrome and Edge DevTools.
axe-core covers WCAG 2.0, 2.1, and 2.2 at levels A, AA, and AAA, plus Section 508 and EN 301 549. Deque's own analysis puts automated coverage at roughly 57% of all WCAG issues — the remainder being the kind of judgment calls (image alt-text appropriateness, keyboard-flow logic, screen-reader announcement order) that only a human can finish. The Pro tier adds Intelligent Guided Tests, which walk a non-expert through those manual checks for one issue type at a time.
With the European Accessibility Act in force since June 28, 2025 and ADA litigation in the United States still climbing year-over-year, automated accessibility scanning has shifted from a nice-to-have to part of the default pre-merge check. For the wider picture, our accessibility testing tools breakdown compares axe against WAVE, Pa11y, and Lighthouse on a per-feature basis.
- Zero false positives on the rules it flags — by design, Deque only ships rules where confidence is high enough to fail a build on.
- Component-level scanning — focus on a single component without re-auditing the whole page.
- WCAG 2.2 rule pack — including target size minimum (24×24 CSS pixels), focus appearance, and dragging-movement alternatives.
7. Wappalyzer — instant tech-stack fingerprinting
Chrome Web Store: Wappalyzer
Wappalyzer inspects a page's HTML, scripts, response headers, cookies, and SSL certificate to identify the technologies powering it — front-end framework, CMS, hosting, CDN, analytics, ads, payment processors. Open any site, click the icon, get a stack diagram.
- Framework detection — React, Vue, Angular, Next.js, Nuxt, Remix, Svelte, and the rest of the modern front-end shortlist.
- Infrastructure read-out — hosting provider, CDN, edge platform (Cloudflare, Vercel, Fastly).
- CMS and commerce — WordPress, Shopify, Webflow, Contentful, and others.
- Tag and analytics audit — every analytics, A/B, tag-management, and ad-tech script that runs.
For competitive research, technical due-diligence on a vendor, or a quick sanity-check on what a page is actually loading, Wappalyzer is the fastest answer. Its paid tiers offer historical stack data, which is useful for tracking when a site migrated off one platform onto another.
8. ColorZilla — color picking and palette analysis
Chrome Web Store: ColorZilla
The standard color-picking extension for the web, with around five million users. ColorZilla covers the full set of color-related tasks a front-end developer needs — eyedropper, palette extraction, gradient generator.
- Eyedropper that samples a single pixel, including over rendered gradients and images, with the value copied to clipboard in HEX, RGB, RGBA, or HSL.
- Page palette analyzer — scans every DOM element on the current page and returns the complete set of colors in use, which is the fastest way to audit whether a site is actually using its design-system tokens or quietly drifting.
- Gradient generator with multi-stop editing and CSS export.
- Zoomed picker for high-DPI displays where the underlying pixel is smaller than the cursor target.
The native DevTools color picker covers the basics. ColorZilla covers the rest.
9. JSON Viewer — readable API responses, no formatter required
Chrome Web Store: JSON Viewer
Open a JSON endpoint in raw Chrome and you get a wall of un-broken text. Install JSON Viewer and the same endpoint renders as a syntax-highlighted, collapsible tree with line numbers and a clickable per-value copy. Trivial in concept, but it saves a hundred small detours into Postman or a paste-into-the-formatter workflow every week.
- Syntax highlighting by type — strings, numbers, booleans, nulls, keys.
- Collapsible nested objects and arrays.
- Find and filter inside large responses.
- Validation — invalid JSON flagged with a pointer to the offending character.
For developers working with REST APIs, GraphQL responses dumped via curl, or any JSON dataset opened directly in the browser, this is a small extension that pays back daily.
Productivity extensions — what makes GitHub usable
10. Octotree — IDE-style file tree for GitHub
Chrome Web Store: Octotree
GitHub's web interface still does not give you a persistent file tree on a repository page. Octotree adds one — a collapsible sidebar that mirrors the directory structure of the current repo, with click-to-navigate, search-within-tree, and pull-request file-tree views. The result feels closer to VSCode in a browser tab than to plain GitHub.
A note on alternatives: Gitako has become a popular free, open-source alternative for developers who prefer to skip Octotree's Pro tier — it covers the same core file-tree functionality and is actively maintained as of 2026. Either one is reasonable; Octotree's Pro features (multi-account, file icons, GitHub Enterprise) only matter if those constraints apply.
- Persistent sidebar with the full directory tree of the open repo.
- PR file tree for navigating changes in large pull requests without endless scroll.
- Private repo support via personal access tokens stored locally.
- GitHub theme awareness — adapts to light or dark mode automatically.
For developers reading unfamiliar open-source code, doing PR review on large repositories, or navigating a monorepo daily, the time savings compound.
11. Refined GitHub — 200+ small fixes the GitHub team has not shipped
Chrome Web Store: Refined GitHub
Refined GitHub is the extension GitHub watches to figure out what to ship next. Its maintainers regularly remove features once GitHub absorbs them natively, and the project still ships 200+ remaining improvements — version 26.5.13 was published on May 13, 2026, with main-branch commits as recent as May 21, 2026.
Examples: it linkifies #1234 issue references inside source files, shows a CI status icon next to the repo name, marks the first Git tag a merged PR was included in (invaluable for tracing which release introduced a regression), hides reaction-only +1 comments except from maintainers, warns when opening a PR from the default branch, adds j/k keyboard navigation through conversation comments, and surfaces the next scheduled run of a GitHub Actions workflow inside the workflows sidebar.
Most individual improvements are small. Cumulatively they shave a measurable amount of friction off a daily GitHub workflow.
AI-assistance extensions — the 2026 addition
The category that did not exist on this kind of list in 2022 has become the most-installed band of all in 2026. Two extensions matter; the rest are mostly thin wrappers.
12. GitHub Copilot — code-aware assistance in the browser
Chrome Web Store: GitHub for Chrome (paired with a Copilot subscription)
Copilot itself runs inside the editor, but its browser surface matters too — GitHub's official extension surfaces Copilot PR summaries, Copilot Chat on pull-request pages, and Copilot-generated commit explanations directly in the GitHub UI a developer is already reading. For teams who pay for Copilot, the browser piece closes the loop between writing code and reviewing it.
It is paid (requires an active Copilot subscription — Individual, Business, or Enterprise). On Business and Enterprise plans, prompts are not used to train models. For a broader picture of how AI is reshaping the QA and review side of this same workflow, see our survey of AI-powered testing tools in 2026.
13. ChatGPT side-panel extensions — inline answers without tab-switching
Chrome Web Store: various — OpenAI's official "ChatGPT" extension and Perplexity's "Perplexity AI Companion" are the most-installed picks in 2026.
These are conceptually identical: a side-panel chatbot pinned to the browser, fed the URL or the selected text of whatever page is in focus, with the answer rendered in the sidebar rather than a separate tab. For looking up a regex, asking what a deprecated API used to return, or summarising a long Stack Overflow thread without context-switching, the time savings add up.
Two cautions. An AI side panel by definition has wide page-content access, so review the permissions and the vendor's data-handling page before installing in a corporate context. And many third-party "ChatGPT-style" extensions in the store are thin wrappers around someone else's API key with unclear retention policies — the OpenAI and Perplexity listings are the ones with the longest published track records.
How to decide what to actually install
The shortlist above is intentionally still a shortlist. A working stack for most developers in 2026 looks something like:
| Role | Default install set |
|---|---|
| Front-end engineer (React stack) | Crosscheck, React DevTools, Redux DevTools (if applicable), axe DevTools, ColorZilla, JSON Viewer, Refined GitHub |
| Full-stack engineer | Crosscheck, the framework DevTools for your stack, Apollo Client Devtools (if GraphQL), Wappalyzer, JSON Viewer, Octotree, Refined GitHub |
| QA engineer | Crosscheck, axe DevTools, JSON Viewer, Wappalyzer |
| Designer / design-adjacent dev | Crosscheck, ColorZilla, axe DevTools |
| AI-assisted across the board | Add GitHub Copilot (browser) + one ChatGPT or Perplexity side-panel extension |
Two practical notes on running this kind of set. First, audit permissions on each install — chrome://extensions lists what each extension can read, and "read and change all your data on all websites" should be reserved for the few extensions where the feature genuinely requires it. Second, re-audit quarterly: the December 2024 phishing campaign compromised the developer accounts of several legitimate extensions and pushed malicious updates affecting more than 2.6 million users across at least 35 extensions. A reasonable extension can become a malicious one in a single auto-update if its publisher account is taken over, which makes a quarterly review cheap insurance.
FAQ
What is the single most useful Chrome extension for developers in 2026?
The answer depends on the stack, but the most broadly useful pick is Crosscheck — because it directly removes work from the bug-reporting step that every developer hits, regardless of framework. After that, the answer is whichever DevTools matches the framework you write in most: React DevTools for React, Vue DevTools for Vue, Apollo Client Devtools if your data layer is GraphQL on Apollo.
Is Lighthouse still worth installing as an extension?
In most cases, no. Lighthouse is now built directly into Chrome DevTools — the "Lighthouse" panel runs the same audits the extension does, and DevTools' Performance panel has absorbed many of Lighthouse's newer "Insights" audits as well. The standalone extension still works but adds nothing the built-in panel does not already provide. Install one or the other, not both.
Are Chrome extensions safe to install in 2026?
Safe enough, with audit. Manifest V3 has tightened what extensions can do at runtime, but the December 2024 incidents showed that publisher-account compromise is a real attack vector. Stick to extensions with established user bases and clear publisher provenance (Meta, Google, Apollo Graph, Deque), audit permissions on install, and remove anything you have not used in 90 days.
Do extensions slow Chrome down?
Cumulatively, yes. Each enabled extension runs a service worker on at least some pages, and a browser with 20 active extensions will feel measurably heavier than one with five. The list above is the set worth that tax.
Where Crosscheck fits
The extensions above optimise individual workflows — your component tree, your color values, your file navigation. Crosscheck optimises the seam between two people: the tester who finds a bug and the developer who has to fix it. When the report arrives in Jira or Linear with the console error, the failed network request, the user-action trail, and the environment metadata already attached, the developer's first ten minutes are no longer reproduction guesswork.
If you ship web applications and you do not yet have a structured bug-reporting flow, Crosscheck is the lowest-friction way to install one — free, single-click install, in the same browser the rest of your developer extensions already live.