Debug a Web Application Step by Step: The Modern Workflow
Debugging a web application is a process of elimination — reproduce the bug reliably, isolate which layer of the stack owns it (frontend, network, backend, or stored state), then use the right Chrome DevTools panel to confirm the diagnosis before writing fix code. Developers who debug fast are not guessing harder — they are following the same handful of steps in the same order on every bug, which means each session converges on the root cause instead of bouncing between hypotheses.
This guide walks through that workflow with a worked example, the 2026 additions to Chrome DevTools, and the often-missed pieces — source maps, remote debugging on mobile, and the diagnostic signatures of the most common bug patterns.
TL;DR
- Reproduce first. A bug you can't trigger on demand is a bug you can't verify fixing.
- Isolate the layer before you fix. Console error, Network 4xx/5xx, stale Application state, or rendering regression — each lives in a different panel.
- Breakpoints beat console.log. Conditional breakpoints and logpoints in Sources inspect runtime state without polluting your code.
- Use source maps. Debugging minified production code without them is debugging blind.
- Mobile bugs need a real device. Chrome over USB for Android, Safari Web Inspector for iOS.
Step 1: Reproduce the bug before touching any code
The single most important rule in debugging is this — do not change any code until you can trigger the bug reliably and on demand. A bug you cannot reproduce is a bug you cannot verify fixing. A bug you can only reproduce sometimes usually means you do not yet understand it well enough to fix it.
Write down the precise sequence of actions that triggers it. Be specific: which route, which browser and version, which user account or role, which interactions in order, what the expected behaviour is, what happens instead. Most bugs are environment-dependent — a bug that appears for one user but not another often comes down to auth state, feature flags, locale, or cached data; a bug that appears in Chrome but not Safari is usually a WebKit-specific CSS quirk or a JavaScript API gap. Without that context you will spend the next hour debugging the wrong scenario.
Once it reproduces, strip the case down. Remove every step that is not strictly necessary to trigger the bug. The simpler the repro, the cleaner the hypothesis space and the easier it is to communicate to a teammate.
Then try incognito. Extensions, cached responses, stale cookies, and service worker caches interfere with web application behaviour in ways that are invisible without isolating them. If the bug disappears in a clean profile, the cause is browser state — a stored token, a cached response, a conflicting extension. That is a different bug than a logic bug in your code, and the fix lives somewhere different.
Step 2: Isolate the layer that owns the bug
Most debugging time is wasted patching the wrong layer. A 500 error from the API is "fixed" with a frontend try/catch. A race condition in state management is "fixed" by hiding the offending UI. Both leave the actual bug intact, ready to resurface six weeks later under a slightly different trigger.
Before opening any code, decide which layer the bug lives in. The four candidates:
| Layer | Diagnostic signature | First panel to open |
|---|---|---|
| Frontend logic | Network request is correct, response is correct, UI handles it wrong | Sources + Elements |
| Network / API contract | Request payload wrong, response body has error, status code 4xx/5xx | Network |
| Backend / data | Request is correct but server returns 500, validation error, or wrong data | Network (response body), then server logs |
| Stored state / config | Bug only appears for some users, sessions, or after specific actions | Application |
The diagnostic is fast — three to five minutes — and it determines everything that follows. A 500 error is not a frontend bug. A correctly-handled 401 redirect is not a backend bug. Get this right and the next 30 minutes of debugging actually progresses.
Step 3: Open DevTools and read the Console
Chrome DevTools is the primary debugging environment for any modern web application. Open it with F12 on Windows or Linux, Cmd + Option + I on macOS, or right-click the page and select Inspect. The four panels you will touch on almost every bug are Console, Network, Sources, and Application — with Performance and Elements close behind.
The Console is the first stop. It captures JavaScript errors, warnings, log output, and network failure notices, all timestamped and linked to the line of code that produced them. Four error types cover most of what surfaces here:
- Uncaught TypeError — a value is being used in a way that does not match its type. Calling a method on
undefined(the infamousCannot read properties of undefined (reading 'x')), passing a non-function as a callback, treating a string as a number. Almost always means a variable holds an unexpected runtime value — frequently because an API response was not shaped the way the code assumed. - Uncaught ReferenceError — code references a variable that does not exist in scope. Typo in a name, accessing a
let/constbinding before it is declared, or referencing a global that is not available in the current environment. - SyntaxError — the engine could not parse the code. In a modern build setup this surfaces during build, but it can still appear at runtime via
eval,new Function, or a malformedJSON.parse. - Failed to load resource — a network request failed. The console shows URL and status code. Move to the Network panel.
Every error comes with a stack trace — the chain of function calls that led to it. Read top to bottom. The top entry is where the error occurred. Click any entry to jump to that line in Sources. Start with the first entry in your own code, not a node_modules path. If your stack trace is mostly framework internals, configure the Ignore List (Settings → Ignore List) to blackbox node_modules and library URLs — the call stack collapses to just your code, which is the only code you can fix.
In production applications the console fills up with warnings and analytics chatter that obscures the actual error. Use the filter buttons to show only Errors, or filter by URL to narrow output to a single script file when one third-party widget is flooding the log.
Step 4: Inspect the Network panel
Many web application bugs are not JavaScript bugs — they are network bugs. A failed API call, a malformed request payload, a missing auth header, or a server-side validation error all manifest as broken UI behaviour without producing any JavaScript error.
Open the Network tab. If you need to capture requests from the initial page load, open DevTools first and then reload — the panel only records requests made while it is open. Filter by Fetch/XHR to isolate API calls from static assets. Scan for red rows — Chrome colour-codes failed requests, and any 4xx or 5xx deserves attention. Click a request and walk the detail tabs:
- Headers — verify the request includes the correct authorisation token, the
Content-Typeis set, and the response headers (CORS, cache, content-type) match expectations. - Payload — for POST/PUT/PATCH, confirm the request body. Missing fields, wrong JSON structure, encoding issues all show up here. Forms often submit empty strings where the server expects null.
- Response — read what the server actually returned. Error responses frequently contain detailed messages that never surface in the UI.
- Timing — a large TTFB points to server-side slowness; a large content-download time points to a heavy payload, which is often the real cause of "the app feels slow."
Common HTTP status codes and what they mean for debugging
| Status | Meaning | Where to look |
|---|---|---|
| 401 Unauthorized | Missing or invalid authentication credential | Authorization header in request; check token expiry |
| 403 Forbidden | Authenticated but not permitted | Backend role / permission config |
| 404 Not Found | URL does not exist | Endpoint path typo; route registration on server |
| 422 Unprocessable Entity | Server understood the request but rejected the data | Response body — field-level validation errors |
| 429 Too Many Requests | Rate limit hit | Retry-After header; client retry logic |
| 500 Internal Server Error | Unhandled server exception | Server logs — the response body rarely tells the full story |
| 502 / 503 / 504 | Upstream or gateway failure | Infrastructure layer; load balancer, container health |
CORS errors are a special case. They appear in the console as blocked-by-CORS-policy messages and in the Network tab as failed preflight OPTIONS requests. The fix is always server-side — adding the correct Access-Control-Allow-Origin and friends. CORS cannot be fixed from the frontend, no matter how many StackOverflow answers suggest it can.
Step 5: Breakpoints, source maps, and the Sources panel
Console logging is useful for quick checks, but breakpoints are the most powerful tool in the debugger. A breakpoint pauses JavaScript execution at a specific line, letting you inspect the exact state of every variable at that moment — no guessing, no commit-and-push cycles to add another console.log.
Open Sources, use Cmd+P (macOS) or Ctrl+P (Windows) to search for a file by name, click a line number in the gutter, then trigger the code path. When execution pauses, the right-hand panel shows local variables, the call stack, and the scope chain. Four controls run the debugger: Step over (F10) executes the current line, Step into (F11) descends into a function call, Step out (Shift+F11) finishes the current function and pauses at the caller, and Resume (F8) continues until the next breakpoint.
Conditional breakpoints, logpoints, and event listeners
In a loop or a frequently-called function, a regular breakpoint pauses on every call — useless if you only care about iteration 247. Right-click a line number and select Add conditional breakpoint to enter an expression like user.id === 'abc-123'. The debugger only pauses when that expression is true.
Logpoints are better than console.log whenever you do not want to commit the log statement. Right-click a line number, select Add logpoint, enter an expression. It is evaluated and logged every time execution passes that line, without pausing and without modifying source. Remove the logpoint and the log goes away — no leftover debug statements in main.
Event Listener Breakpoints (right-hand panel in Sources) pause on specific DOM events — clicks, form submissions, keypresses, network requests — without knowing which function handles them. Invaluable when you can see a user action triggering a bug but cannot find the handler in code.
Source maps — debug the code you actually wrote
Production JavaScript is minified into single-letter variables and one-line files. Setting a breakpoint in that is hopeless. With source maps, DevTools displays your original TypeScript, JSX, or unminified JavaScript in Sources — and breakpoints, variable names, and stack traces all map back to it. Most modern bundlers (Vite, Webpack, esbuild, Turbopack) emit them with a single config flag. If your production stack traces still show minified single-letter names, fix source maps first — every other debugging investment compounds on that foundation.
Step 6: Inspect the DOM, CSS, and application state
For layout, visibility, and styling bugs, the Elements panel is the debugger. It shows the live DOM tree — not the original HTML source, but the actual current state of the document as modified by JavaScript. Three scenarios cover most of what you will see here.
An element that should be visible but is not — select it in Elements and check the Styles pane for display: none, visibility: hidden, opacity: 0, height: 0, or an off-screen transform. The Computed tab shows the final resolved styles and cuts through specificity or cascade confusion. A click handler that is not firing — select the element, click the Event Listeners tab in the right panel, verify the expected listener is attached; if it is not, the selector did not match what you thought it matched. Styles that are not applying — strikethrough text in the Styles pane indicates an override by a more specific rule, with selector specificity and source location shown next to each.
The Application panel surfaces data that persists in the browser — cookies, localStorage, sessionStorage, IndexedDB, service workers, the cache. Inspect localStorage and sessionStorage for outdated tokens or stale values; check cookies for expiry, domain, and path scoping (SameSite and Secure flags matter for cross-site auth flows); view, force-update, or unregister service workers entirely while debugging. The classic "works on my machine but not in staging" bug is, surprisingly often, a stale service worker holding onto a build from three deploys ago.
Step 7: Performance and the 2026 DevTools additions
The Performance panel has changed materially over the past year. Chrome's Performance Insights identifies bottlenecks — render-blocking scripts, oversized images, LCP request discovery issues, legacy and duplicated JavaScript — and surfaces actionable fixes from the same panel. The Live Metrics screen opens when you first hit Performance, showing Core Web Vitals (LCP, INP, CLS) that update as you interact with the page. It is the fastest way to spot performance issues that only appear under certain interactions, particularly INP regressions on a specific click handler.
Chrome 134 added third-party dimming to the Performance panel. Toggle "Dim 3rd parties" and the panel greys out chat widgets, analytics scripts, and ad networks, leaving only your first-party code highlighted. The visual difference is often shocking — and it is the single fastest way to tell whether your "slow page" is actually a slow page or a slow Intercom widget. Chrome 134 also introduced "Low-tier mobile" and "Mid-tier mobile" CPU throttling presets calibrated against real device performance data, replacing the guesswork of "4x slowdown."
Chrome DevTools now includes AI-assisted analysis with access to Lighthouse data, which can answer open-ended performance questions and surface context that previously required digging across multiple panels. The widgets give visibility into the model's reasoning rather than opaque conclusions, which matters because performance fixes you do not understand tend to regress within two sprints. For deeper coverage of the Performance panel and how to read a flame chart, the Chrome DevTools performance auditing guide goes further on the trace itself.
Step 8: Remote debugging mobile devices
A frustrating share of production bugs only appear on real phones. Touch latency, viewport quirks, iOS WebKit-specific behaviour, slower networks, and the absence of hover all combine to produce bugs that responsive-design mode cannot reproduce. Two workflows cover the platforms.
Android — Chrome DevTools over USB
On the Android device, enable Developer Options (Settings → About phone → tap Build number seven times) and turn on USB debugging. Connect over USB. On the desktop, open chrome://inspect/#devices. The phone appears with a list of its open Chrome tabs. Click inspect on any tab and a full DevTools window opens against that mobile session — same panels, same breakpoints, same Network capture as desktop.
iOS — Safari Web Inspector (and Chrome on iOS 16.4+)
On the iOS device, Settings → Safari → Advanced → enable Web Inspector. On the Mac, Safari → Settings → Advanced → enable "Show Develop menu in menu bar." Connect via cable. In Safari's Develop menu, your device appears with its open tabs; select one and Web Inspector opens against it.
Chrome on iOS used to be undebuggable in release builds — until iOS 16.4 and Chrome 115 enabled WKWebView remote inspection. Enable Web Inspector in Chrome iOS settings (Content Settings → Web Inspector), then use the same Safari Develop menu on the Mac to attach. The iOS frame is not shown, but the inspector is the real thing.
For Windows or Linux machines debugging iOS, ios-webkit-debug-proxy (an open-source Google project) bridges the Safari Remote Web Inspector to the Chrome DevTools Protocol, with the usual caveat that anything WebKit-specific is still inspected through the WebKit lens.
A worked example: the missing dashboard data
To make the workflow concrete, here is a typical bug walked through panel by panel.
Report: A logged-in user opens the dashboard. The recent-activity widget should show their last ten actions. It shows a perpetual loading spinner.
Step 1 — reproduce. The reporter is on Chrome 134, macOS, logged in as a viewer-role user. In incognito, logging in as the same user reproduces the spinner. Same browser, same data state. Reproduction confirmed.
Step 2 — isolate the layer. Open DevTools. The Console shows no JavaScript errors — so it is unlikely to be a frontend crash. The spinner suggests an unresolved promise. Move to Network.
Step 3 — Network panel. Filter by Fetch/XHR. Reload the dashboard. The request GET /api/users/me/activity?limit=10 appears in red. Status: 403 Forbidden.
Step 4 — inspect the response. Click the request. The Response tab contains a JSON body: { "error": "insufficient_role", "required": "admin", "user_role": "viewer" }. The diagnosis is clear within sixty seconds — the endpoint requires admin role, but the dashboard widget is shown to all roles.
Step 5 — confirm with a breakpoint. Open Sources. Cmd+P to find DashboardActivity.tsx. Set a breakpoint on the useEffect that fires the request. Reload. The breakpoint hits. Step over until the request is dispatched, then resume. The component never handles a 403 — it leaves the promise in a pending state and renders the loading skeleton forever. That is two bugs, not one.
Step 6 — decide the fix. The widget being shown to non-admin users is a backend authorisation bug (or a frontend rendering bug, depending on the product decision). The infinite spinner on error is a frontend bug — the component must handle 4xx responses and render an empty or fallback state. Fix both, write a regression test for the role check, and add a generic 403 handler at the data-fetching layer so the next endpoint that does this does not silently spin.
The total elapsed time, with the workflow above, is around fifteen minutes. Without the panel-by-panel discipline, the same bug typically becomes a half-day investigation because the symptom — a spinner — looks like a frontend issue.
Common web application bug patterns and their diagnostic signatures
Five categories cover the majority of production bugs. Each has a characteristic signature in DevTools, which is how seasoned engineers diagnose them in minutes rather than hours.
Race conditions
Asynchronous JavaScript is a common source of bugs that reproduce inconsistently. Two async operations complete in an unexpected order — a component renders before its data fetch resolves, a user clicks a button twice before the first action finishes, a token refresh and an authenticated request fire in parallel.
Diagnostic: add logpoints around the async operations, observe the order they complete in across multiple runs. Check that promises are awaited correctly and that the React/Vue/Svelte component handles intermediate states.
State management bugs
In framework-driven apps, bugs frequently live in how state is updated and propagated. A component renders with stale state, a mutation updates the wrong slice, or a derived value does not recompute when its source changes.
Diagnostic: use the framework's devtools extension (React DevTools, Vue DevTools, Redux DevTools) to inspect the component tree, current props and state, and re-render history. The mismatch between "what state should be" and "what state actually is" is usually visible within seconds in the extension.
Memory leaks
Memory leaks manifest as the page becoming progressively slower and more sluggish, eventually crashing the tab. Common causes: event listeners attached in component lifecycles and never removed, closures holding references to large objects, timers or intervals that are never cleared.
Diagnostic: the Memory panel. Take a heap snapshot, perform the suspect action ten times, take another snapshot, compare. Object counts that grow without bound are the leak.
Third-party script interference
Analytics, chat widgets, A/B testing frameworks, ad networks — every third-party script runs in the same browser context as your application code. Any of them can throw errors, slow page load, or conflict with event handling.
Diagnostic: the Chrome 134 "Dim 3rd parties" toggle in the Performance panel makes this immediately visible. For functional bugs, disable extensions, test in a clean profile, then use Network request blocking to selectively disable third-party domains.
CSS and layout bugs
Visual regressions, broken responsive layouts, z-index conflicts, and CSS specificity issues.
Diagnostic: Elements panel, Computed tab, and the Layout overlay (in the Elements panel, hover a flex or grid container to see its tracks). For systematic visual regressions across builds, the best visual regression testing tools catch what manual inspection misses.
Document what you find
Debugging produces knowledge. A bug that took two hours to track down should not require two hours again if it resurfaces, or if someone else encounters it. The minimum useful record is four lines:
- The reproduction steps
- The root cause (one sentence)
- Which tools and panels revealed it
- The fix applied and why
In a team this is the difference between a knowledge base and tribal memory. Tribal memory leaves with whoever wrote the code. For more on the upstream side of this — what a bug report should contain so the engineer who fixes it does not have to recreate this whole process — the perfect bug report template is the starting point.
FAQ
What is the first thing to do when debugging a web application?
Reproduce the bug reliably. A bug you cannot trigger on demand is a bug you cannot verify fixing. Capture the exact steps, browser, user state, and what differs from the expected behaviour before opening any code.
How do I debug a JavaScript error in the browser?
Open Chrome DevTools (F12), read the error in the Console panel, click the file/line link in the stack trace to jump to Sources, set a breakpoint on the offending line, then trigger the error again to inspect runtime state in the scope panel.
What is the difference between Console and Network debugging?
Console shows JavaScript runtime errors and log output. Network shows HTTP requests and responses. A failed API call may show up in Console as "Failed to load resource" but the actionable details — status code, request payload, response body — live in Network.
Why is my breakpoint not being hit?
Three common reasons: the code path is not actually executing (verify with a console.log or logpoint earlier in the file), the breakpoint is on a line that is in a different bundle than what is loaded (clear cache, hard reload), or source maps are mapping to a different line than expected (check the source map in Sources → page sources).
How do I debug a web app on a real mobile device?
For Android, enable USB debugging and open chrome://inspect/#devices in desktop Chrome. For iOS, enable Web Inspector in Safari settings (or Chrome iOS settings on iOS 16.4+) and use Safari's Develop menu on a Mac to attach.
What is the best way to debug a CORS error?
You cannot fix CORS from the frontend. The fix is on the server — adding the correct Access-Control-Allow-Origin, Access-Control-Allow-Methods, and Access-Control-Allow-Headers response headers. In DevTools, the preflight OPTIONS request in the Network tab shows what the browser asked for and what the server returned — the gap between the two is the fix.
When should I use a logpoint instead of console.log?
Always, if you do not want to commit the log statement. Logpoints live in DevTools, not in source code, so they cannot accidentally ship to production. Right-click a line number in Sources, select Add logpoint, enter the expression.
Debug faster by capturing the full diagnostic context up front
A systematic DevTools workflow is the foundation of good debugging — but it depends on whoever reported the bug capturing enough information that the engineer can reproduce it. In practice, most bug reports do not include console errors, network status codes, or browser version. The engineer reproduces the issue first, captures the context themselves, then debugs. That first step is where hours leak out of the engineering team's week.
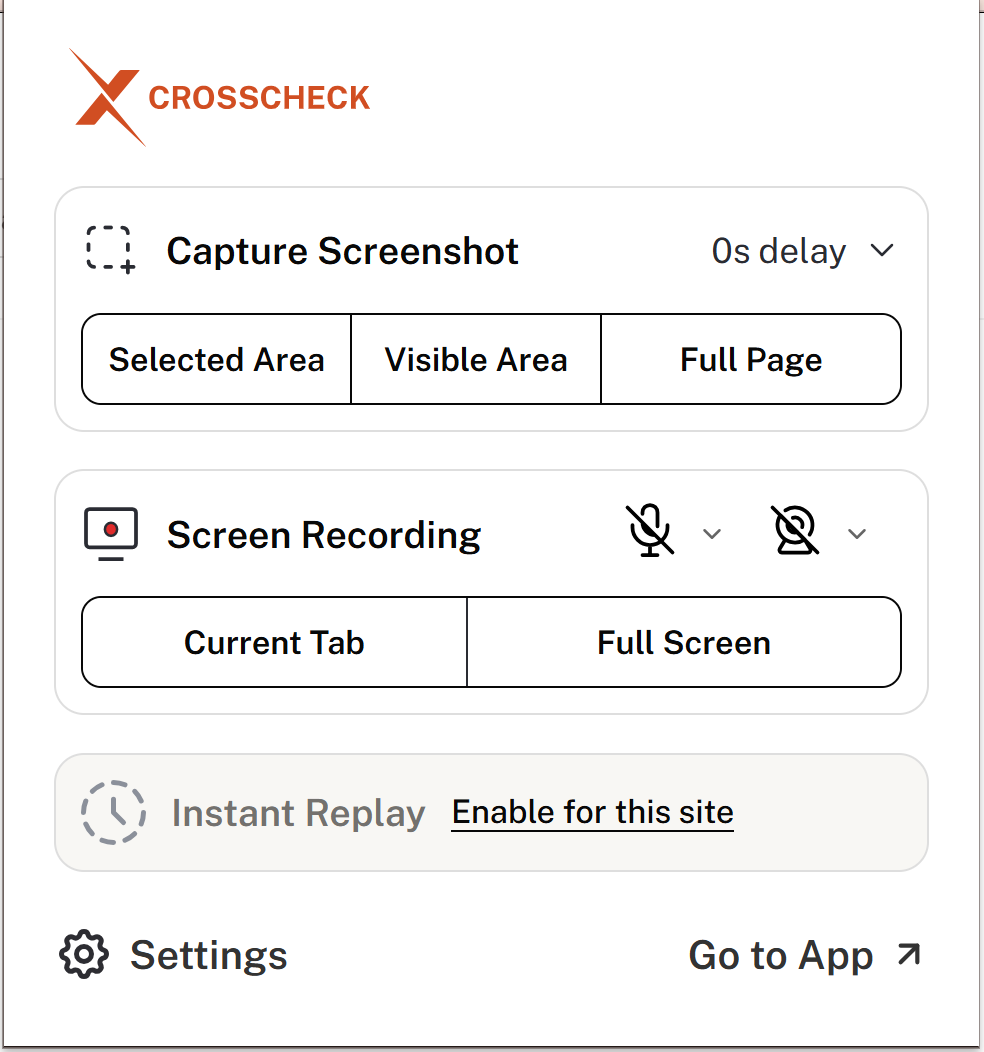
Crosscheck is a free Chrome extension that closes that gap. When a bug is captured with Crosscheck, the report includes a screenshot, a screen recording, the full console log (including errors and warnings), every network request made in the session with status codes and response details, and the browser environment — all attached to the Jira, Linear, ClickUp, GitHub, or Slack ticket automatically. The engineer opens the report with the same context they would have collected themselves in the first ten minutes of debugging, which means the next forty minutes go into the actual fix.