Dashboard in Software Development -PMs, Devs & QA Insights In today's data-driven world, the amount of information at our fingertips is staggering. A report from 2023 Statista report predicts that by 2025, the amount of data created, consumed, and stored will reach over 180 zettabytes. This number is so incredibly large that it's difficult to understand! For brands, this presents both a challenge and an opportunity.
Sorting through a lot of information can be difficult.
This is where dashboard reporting becomes a life-changer. Dashboards display important data in a clear way using data analytics. This helps everyone on the team, such as project managers, testers, and developers, to understand and improve their work.
In this blog, we will discuss how dashboards are important in software development. We will focus on how Crosscheck helps teams use their data better with role-based dashboards.
Lost in the Big Data: Why Dashboards are Essential for Software Development When you have a lot of spreadsheets and reports to deal with, finding one piece of information wastes time and leads to frustration. Each document contains essential information. But without a single place to see everything, it's hard to know how the project is really going.
Are there still lots of bugs? Will we meet our deadlines? These important questions become unclear.
Teams struggle to work together when dealing with data scattered across different tools. This fragmentation of data across multiple tools can result in significant challenges for the software companies.
At the end, you might be paying for many tools that do similar things, but none give you a complete view.
Now, Dashboards solve a significant portion of these problems. All your software development information is gathered in one place. This provides a clear overview of important details.
Advantages of Dashboard in Software Development Lifecycle. Centralized Data Management: Dashboards consolidate data from all SDLC stages into one location, providing a comprehensive overview and saving time by eliminating the need to switch between tools. According to Moldstud, centralized project management can boost productivity by up to 26%. Real-time Visibility: Dashboards offer up-to-the-minute data, allowing teams to monitor project status and progress instantly. Actionable Insights: Visual representations like charts and graphs on dashboards make it easy to spot trends and potential issues. McKinsey & Company reports that effective use of data visualization can improve decision-making efficiency by up to 45%. Performance Monitoring: Dashboards track key performance indicators (KPIs) and metrics in real-time, helping teams ensure they meet their goals. This ongoing monitoring supports continuous improvement throughout the SDLC. Improved Communication: Serving as a central reference point, dashboards enhance collaboration and transparency among team members. The FirmAdvisor say that businesses with effective communication are 50% more likely to have lower employee turnover. Optimized Workflow Management: Dashboards provide quick access to essential information, enabling teams to optimize their workflows and focus on core tasks. Crosscheck Dashboards: Personalized Views for Each Team Member Crosscheck takes dashboard reporting to the next level by offering a suite of role-spec
ific dashboards and intuitive dashboard designs. This ensures that each team member has the information they need, presented in a way that maximizes their efficiency.
1) QA Dashboard

qa dashboard
KEY FEATURES QA ‘My Report’:

QA
QA Report in test management tool
The QA Report Widget offers significant workflow benefits.
For instance, a QA manager quickly noticed 15 bugs reported today—five reopened and ten retested. This clear overview allows efficient resource allocation, especially for reopened bugs, keeping the project on track.
Additionally, the widget’s data-driven approach aids better decision-making. If a QA lead finds numerous bugs in a module, they can investigate, identify root causes, and implement solutions, improving product quality and functionality.
During sprint planning, everyone from developers to product owners can review the status of test cases and bugs through clear visual representations. This shared understanding leads to better decisions and more effective task management.
The simple interface helps new team members learn and contribute quickly, saving time and costs. It speeds up the release cycle and helps the team deliver high-quality products faster.
My Reported Bugs:

reported bugs
Bugs reporting in test management tool
The "My Reported Bugs" feature further smooths the QA process. It lets you track all reported issues—closed, open, reproducible, needing discussion, or blocked—in one place. This software organizes defects by project, easing the management of multiple projects.
Each issue has a unique ID for quick reference and detailed tracking, eliminating confusion. Getting feedback and updates on each issue helps understand its past and current status, making it easier to plan next steps.
You can clearly mark issues by severity, enabling you to prioritize critical ones first. If a bug requires team input, the team flags it for discussion to ensure nothing gets missed in meetings.
Blocked defects are easy to spot and escalate, saving time and maintaining workflow. This organized system reduces time spent searching for information, boosting productivity by focusing on issue resolution.
My Test Run

test run
Test run in test management tool
The crosscheck testing dashboard displays all test runs, whether they are due, upcoming, or completed. This eliminates the need to search through lists or reports. You can prioritize tests based on deadlines and urgency.
Identify trends in bug types:

identifying the bugs
Bugs Reports in test management tool
2) Project Manager Dashboard: Crosscheck offers project management metrics, KPIs dashboard for project managers to easily overview of everything happening across projects in testing stage.

project management dahboard
Project management dashboard in Crosscheck
KEY FEATURES Projects Summary: The project manager dashboard provides a summary of essential project metrics, including the total number of projects, test cases, bugs, test runs, and users. Monitor the status and progress of multiple projects from a single dashboard, saving time and effort.
Overall QA Reports:

overall qa reports
Project Manager can view all QA performance in one place
Project managers or lead can track individual tester performance, identify areas where testers excel, and provide targeted feedback or training opportunities.
Using data to make decisions helps you decide where to put resources, prioritize testing, and adjust your QA strategy.
Overall Developer Reports:

developer report
Project Manager can view all Developer performance in one place
All developer reports offer critical benefits. Managers can monitor bug statuses and severities to identify potential risks early and take proactive measures, ensuring smoother project execution. Additionally, the dashboard provides insights for setting realistic goals, timelines, and resource requirements for future projects.
Monitoring individual developer performance helps identify high performers and those needing additional support or training. This targeted approach enables managers to offer specific training to improve efficiency and address challenges. The dashboard shows project progress in real-time, helping managers update stakeholders and keep transparency.
These reports and dashboard improve project management by helping with risk management, cost control, strategic planning, and supporting the team effectively. Project health check has become easier with Crosscheck, a test management tool.
3) Developer Dashboard: A single place for managing bugs efficiently, helping developers prioritize tasks. Developers can manage their workflow, focus on critical bugs, and deliver high-quality code.

developer dashboard
Developer Dashboard and reports
KEY FEATURES My Bugs, Opened, Closed The developer dashboard widget provides essential insights into bug management and project progress. It displays the numbers of bugs opened, closed, and needing discussion, allowing developers to track the status of issues they're working on.
Additionally, the widget shows active projects, giving developers visibility into ongoing work and helping them stay informed about project priorities and deadlines.
Bugs Reproducible Rate The "Bugs Reproducible Rate" metric serves multiple purposes. Firstly, it aids in prioritizing bug-fixing efforts by highlighting bugs with a high reproducibility rate.
Knowing the reproducibility rate helps developers use resources better. They can spend less time on hard-to-find bugs and focus on fixing common issues that affect users
Setting benchmarks for Bug Reproducible Rate can help track performance and set realistic goals. These benchmarks are based on project complexity and development processes. They can also help improve bug resolution and product stability.
Current Assigned Bugs

assigned bugs
Assigned Bugs to developers in crosscheck
The "Current Assigned Bugs" widget in the developer dashboard show all bugs currently assigned to you. This eliminates the need to search through various lists or reports, saving time and helps you stay focused on resolving them.
4) Custom Dashboard (Premium Plan):

custom dashboard ( premium)
create custom dashboards
For users with premium plan, Crosscheck offers the ability to create custom dashboards that go beyond pre-built templates. To make informed decisions about your specific software testing needs, you can determine the most important metrics for your project.
Crosscheck dashboard and reporting software allows you to choose from a wide range of KPIs. For example, a specific dashboard for a security project can display the number of severe bugs discovered.
It can also show the time taken to resolve significant issues. You can change the information shown to match what you want and like.
The Power of Visualization in Custom Dashboards:

visualization of the dashboards
custom dashboards in test management tool
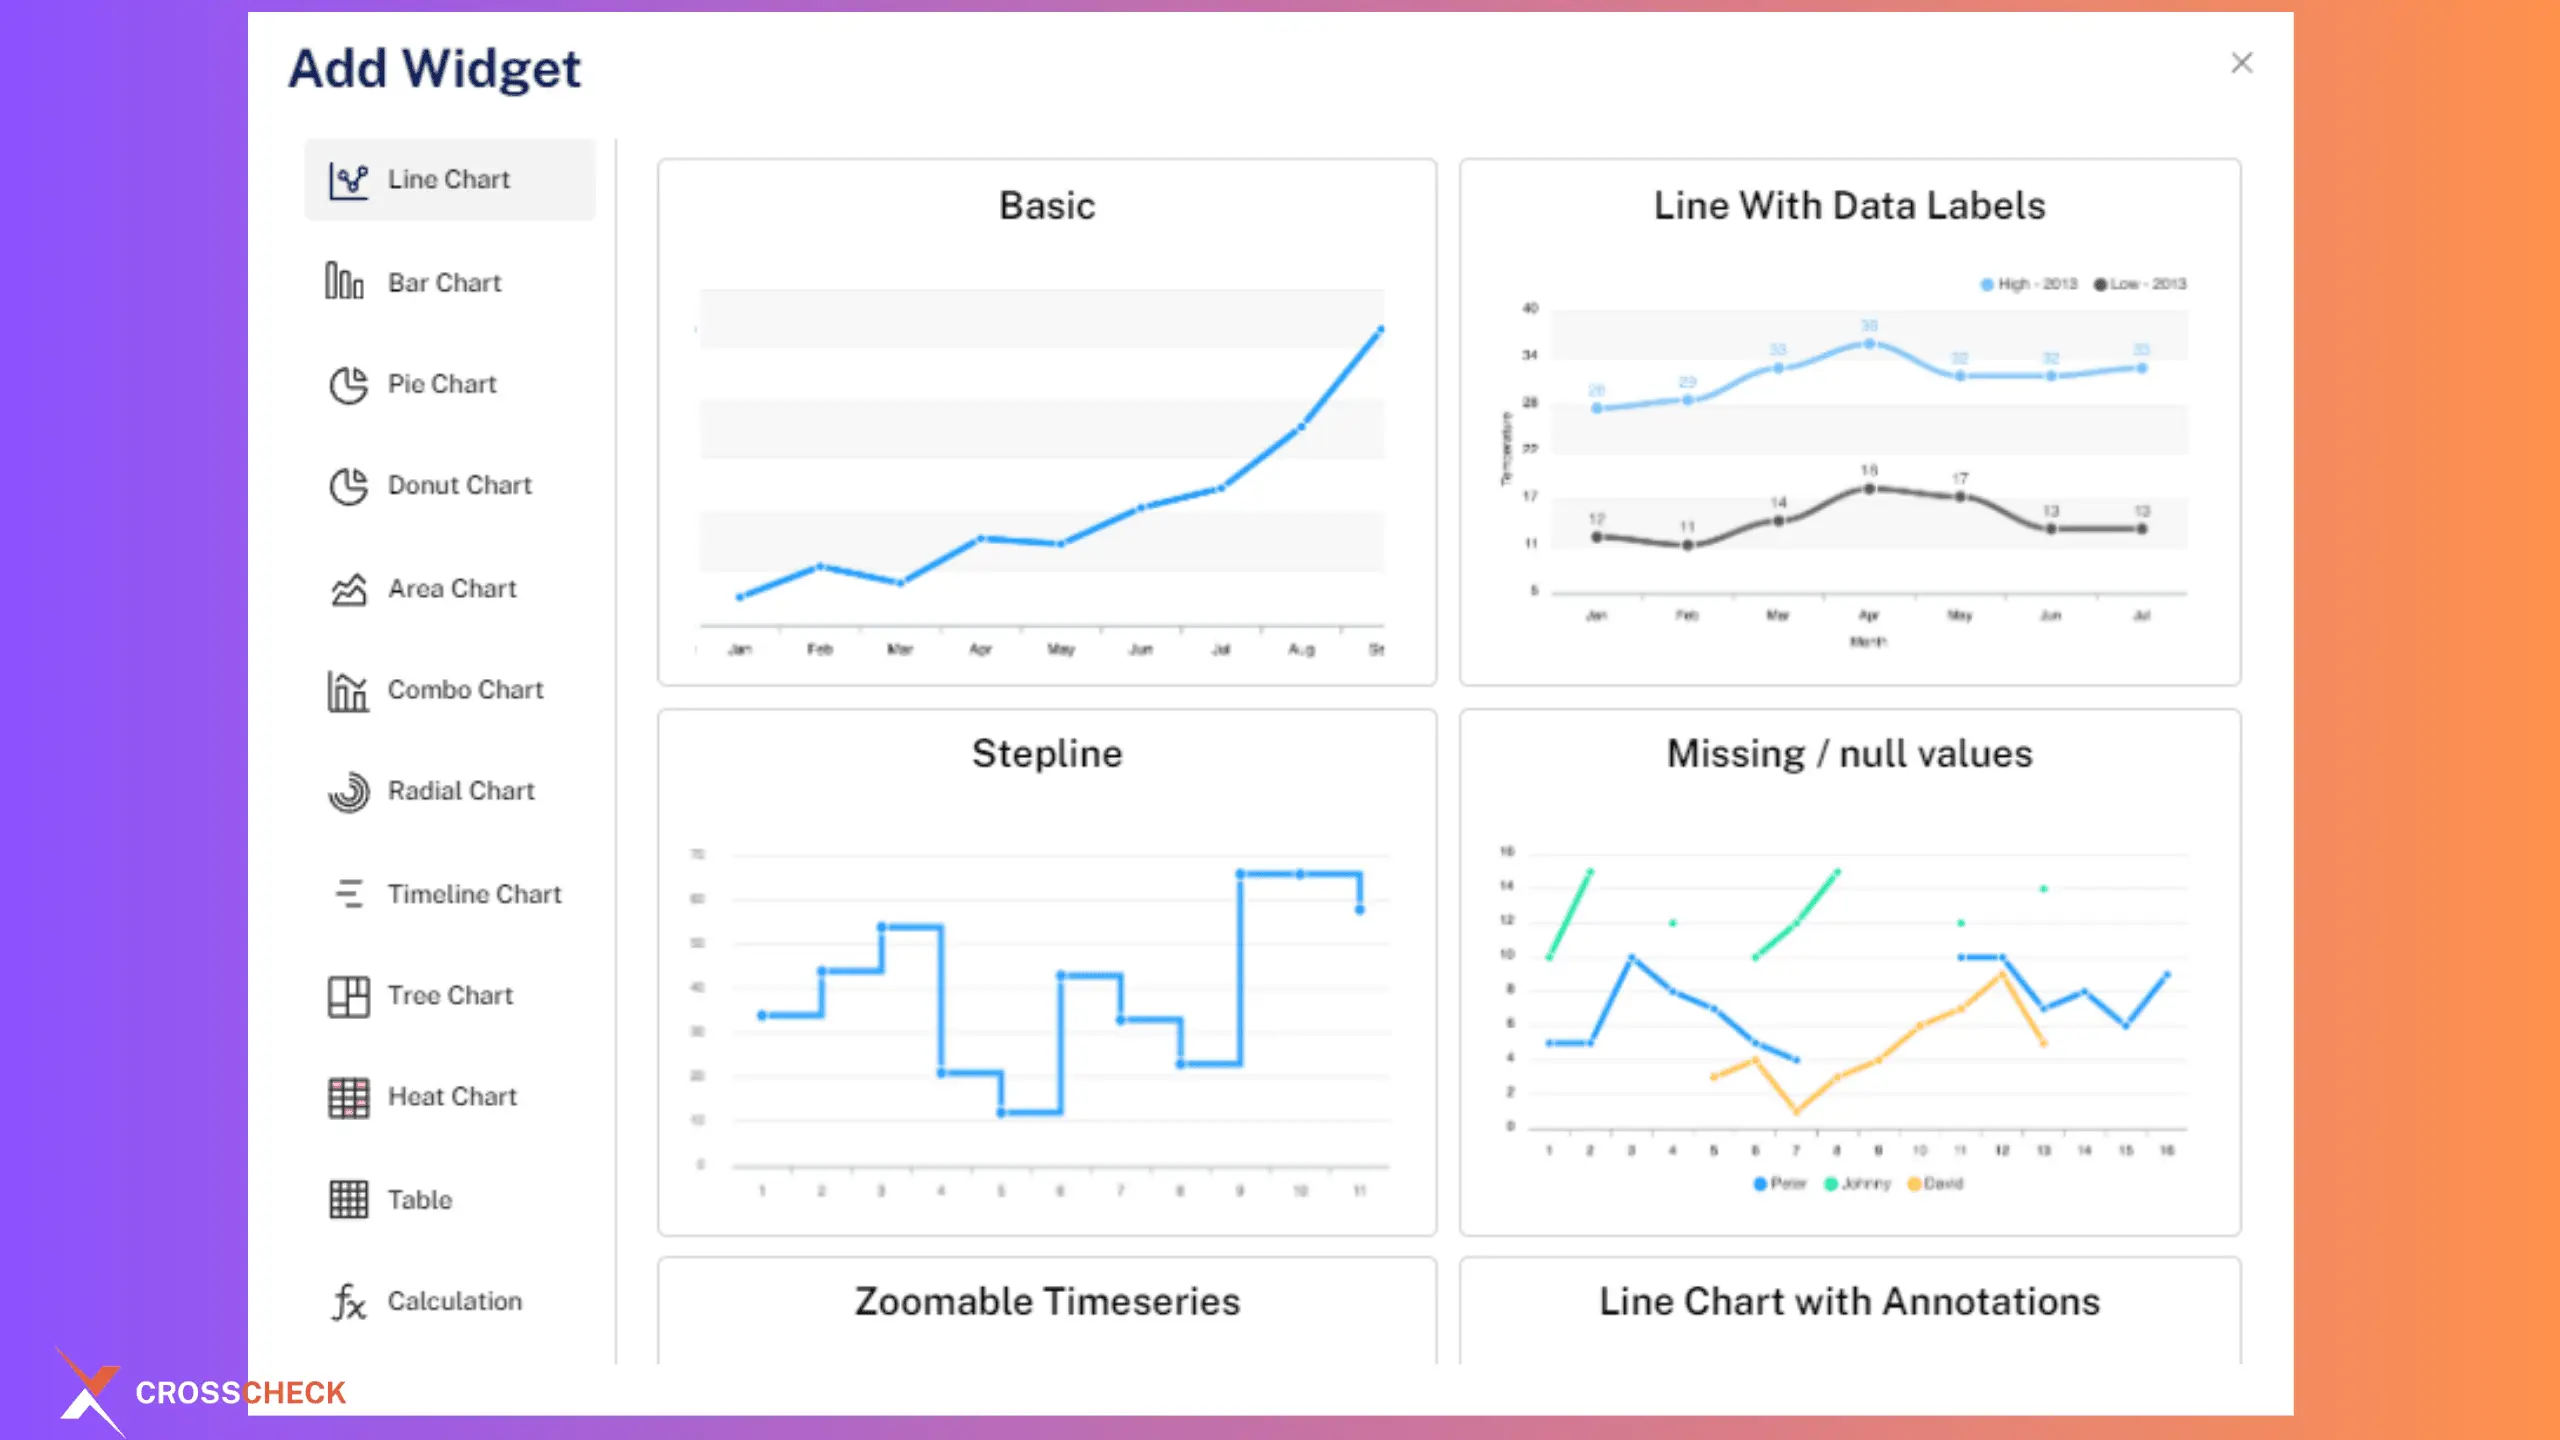
Choosing the right dashboard type and visualizations is key for effectively displaying data. Crosscheck empowers your team members to choose the appropriate graphs and charts for their intended use case. Here are some common visualization options:
- Bar Charts: Ideal for comparing different categories of data.
- Line Charts: Excellent for showing trends over time.
- Pie Charts: Useful for depicting the composition of a whole.
- Timeline charts: Display events in chronological order.
- Combo Charts: Combine different chart types to compare multiple data sets in one visualization.
By selecting the right visualizations, you can transform complex data sets into clear and actionable insights.
The Crosscheck Advantage for the Software Industry The Crosscheck dashboard is extremely helpful for manual testing in software development projects. This dashboard for manual testing makes QA teams work smarter by showing bug trends, tester performance, and how effective testing is in real-time. It also works as project management dashboard software for the team.
Ideal for Startups and SMEs The beauty of Crosscheck dashboards lies in their simplicity and comprehensiveness of data analysis.
Crosscheck is perfect for startups and small to medium-sized businesses. They may not have the resources for complicated reporting tools. This test management tool makes manual testing easier by handling 90% of the process in one place, improving software development efficiency. Crosscheck dashboards can help businesses stay competitive.
I would highly suggest you give it a try. The starting price for the basic plan is $8 per user. This plan includes the dashboard, test cases, test runs, integrations with Clickup and Jira and much more. Or try Free plan now!