How to Capture Network Logs for a Bug Report
A network log is a record of every HTTP request and response a browser exchanges with a server during a session — URL, method, status code, headers, payload, timing — and including one in a bug report is the difference between a developer guessing at the cause and reading it directly off the wire. The standard export format is the HAR (HTTP Archive) file, a JSON document every major browser produces from its Network panel. This guide covers what's inside a HAR, how to capture one in Chrome, Firefox, Safari, and Edge, what headers to redact before sharing, which status codes actually matter at triage, and how to attach the result to Jira, Linear, or a Slack thread without losing the engineer's afternoon to file-size limits.
Key takeaways
- A bug report with a network log answers what the API returned before the developer asks. Reports without one bounce back for clarification roughly half the time, based on Crosscheck's own customer-base audits.
- Every modern browser exports the HAR 1.2 format — a JSON record that has been the de facto standard since the W3C Web Performance draft stalled in 2012.
- Chrome 130 (September 2024) and later redact sensitive headers like
CookieandAuthorizationfrom HAR exports by default. Firefox and Safari still ship raw HARs and require manual redaction. - The four status codes that drive most triage decisions are 400, 401, 403, and 500 — each points at a different layer of the stack and a different team.
- For teams capturing network logs on every bug, the manual DevTools flow is the bottleneck. Tools like the Crosscheck Chrome extension attach the network log automatically with credentials filtered by default.
What is in a HAR file
A HAR file is a JSON archive with a single top-level log object that contains a creator (the browser or tool that produced it), a pages array (page-level timings), and an entries array — one entry per HTTP request the browser made during the capture window. Each entry includes the request method, full URL, request and response headers, the request body for POST and PUT calls, the response body (subject to the size limits below), cookies, query parameters, and a timings block broken down into DNS lookup, TCP connect, TLS handshake, send, wait, and receive phases.
The format is stable at version 1.2, frozen since February 2011. The W3C Web Performance Working Group draft that would have made it an official recommendation was abandoned and the W3C page now explicitly says "DO NOT USE" at the top — but the spec stuck anyway, every browser implements it, and every observability vendor parses it. For practical purposes HAR is the universal lingua franca of network traces.
A HAR captures everything in the network tab. That is its strength as evidence and its risk as a shared artefact. We come back to redaction in a section of its own further down.
There are two limits worth knowing before you rely on a HAR for forensic evidence. Chrome truncates HAR exports at around 12 MB, which can produce an incomplete JSON tail on a long single-page-application session. Firefox truncates individual response bodies above 1 MB by default unless you flip devtools.netmonitor.har.includeResponseBodies and accept much larger files. If you are capturing a multi-hour session against a heavy app, expect to lose some response bodies and plan to reproduce in shorter capture windows.
When the request is failing vs when the response is wrong
Before you start capturing, decide which of two bug classes you are looking at — because the network log reads completely differently for each.
A failing request is a network call that did not produce a usable response: a 4xx or 5xx status, a CORS block, a connection reset, a timeout, or a request the application abandoned because the user navigated away. The HAR entry will have an obviously bad status code or no response at all, and the bug is usually a backend, infrastructure, or auth issue.
A wrong response is a network call that returned a perfectly clean 200 — but the body contained something the UI could not handle, the wrong record, an empty array, a stale value, or a schema the frontend was not expecting. The HAR entry looks completely healthy in the status column. The evidence lives inside the response body, and the bug is almost always either a backend data issue or a frontend rendering bug downstream of a successful call.
Mixing these up wastes hours. "The button does nothing" can mean the POST returned 500 (failing request) or it returned 200 with a misleading payload that the client silently dropped (wrong response). The first paragraph of the bug report should make the distinction — the network log then proves it.
How to capture network logs in Chrome
Chrome's DevTools Network panel is the most common starting point and has been the reference implementation other browsers chase. The flow:
- Open DevTools.
Cmd + Option + Ion macOS,Ctrl + Shift + Ion Windows or Linux, or right-click anywhere on the page and choose Inspect. - Click the Network tab. If the tab is empty, the panel was not open when the page loaded — reload to start a fresh capture.
- Enable Preserve log. The checkbox sits in the top toolbar of the Network panel. Without it, every navigation clears the log and you lose requests from earlier pages in a multi-step flow.
- Tick Disable cache. This forces every asset to come over the wire, so the HAR reflects what a cold user would see. Skip this only if the bug is specifically about cached behaviour.
- Reproduce the bug. Every request made during the reproduction appears in the panel in real time, colour-coded by status.
- Export the HAR. Right-click anywhere in the request list and choose Save all as HAR with content. The "with content" wording matters — without it, response bodies are stripped and the export is much less useful for debugging.
One change worth knowing about. From Chrome 130 (released September 30, 2024) onwards, HAR exports automatically exclude sensitive data — Cookie and Authorization headers, set-cookie responses, and a handful of other credential-bearing fields are stripped on the way out. Older Chrome versions and explicit "Export with sensitive data" toggles still produce the unredacted version. If you are pulling a HAR from Chrome 130+ for a colleague, assume credentials are already gone. If you are pulling one from Chrome 129 or earlier, treat the file as a credential.
Edge uses the same Chromium-based DevTools and the same export menu, so the Chrome instructions apply identically. The shortcut, the Preserve log toggle, the "Save all as HAR with content" option — all the same. Chromium Edge inherits Chrome's HAR sanitisation behaviour too.
For a deeper tour of what else the Network panel can do beyond exporting HARs — request blocking, throttling, waterfall analysis — Crosscheck's Chrome DevTools complete guide walks through the rest of the panel.
How to capture network logs in Firefox
Firefox has supported manual HAR export from the Network panel since version 41 (2015) and the UI has barely changed since. The flow:
- Open Web Developer Tools. Press
F12orCtrl + Shift + Ion Windows and Linux,Cmd + Option + Ion macOS. - Click the Network tab.
- Tick Persist Logs and Disable Cache. Both checkboxes live in the toolbar at the top of the Network panel.
- Reproduce the bug.
- Export. Two options — click the Export HAR (sanitized) icon in the Network panel toolbar, or right-click any request and choose Save All As HAR.
The label sanitized on the Firefox export button is misleading. Firefox does not redact sensitive headers by default the way Chrome 130+ does. "Sanitized" here refers to formatting and field normalisation, not credential filtering. Treat every Firefox HAR as if it contains live cookies and tokens until you have manually verified otherwise.
If you need automated capture — running a HAR export from a Selenium suite, for example — Mozilla maintains the official HAR Export Trigger extension, which exposes a JavaScript API for triggering exports from page scripts. For most bug reports the manual right-click is faster.
How to capture network logs in Safari
Safari's Web Inspector hides the network panel behind two layers of preference. The first time you do this is the slowest. The flow:
- Enable the Develop menu. Open Safari > Settings (or Safari > Preferences on older macOS), go to Advanced, and tick Show features for web developers (older versions called this "Show Develop menu in menu bar").
- Open Web Inspector. From the new Develop menu, choose Show Web Inspector, or press
Cmd + Option + I. - Click the Network tab.
- Enable Preserve Log and Disable Caches. Both controls live in the Network tab toolbar — Preserve Log is hidden under the small dropdown icon that looks like three stacked lines.
- Reproduce the bug.
- Export the HAR. Right-click any request and choose Export HAR, or use the Export button on the far right of the Network toolbar.
Safari, like Firefox, does not strip credentials. Sanitise manually before sharing externally.
For mobile bugs, Safari is the only way to get a HAR from an iPhone or iPad. Connect the device to a Mac with a cable, enable Web Inspector on the device under Settings > Safari > Advanced, then on the Mac open Develop > [Your Device Name] > [the tab] and follow the desktop instructions. iOS Safari is the one mobile browser with a real network panel — every other mobile browser requires a proxy like Charles or mitmproxy if you need a HAR-equivalent trace.
Status codes and headers worth knowing at triage
A complete HTTP status reference is the IANA registry, but the codes that actually drive bug triage are a small subset. The shortlist worth memorising:
| Status | Meaning | Typical cause |
|---|---|---|
| 200 | Success | If the bug is still happening, the problem is in the response body, not the request |
| 301 / 302 | Redirect | A flow that depends on staying on one URL but the server is bouncing the client elsewhere |
| 400 | Bad request | Malformed payload — missing field, wrong content type, validation failed on schema |
| 401 | Unauthorized | No credentials or expired token — auth header missing or session timed out |
| 403 | Forbidden | Authenticated but not permitted — role or scope is wrong |
| 404 | Not found | Endpoint or resource ID does not exist — often a routing or deletion bug |
| 422 | Unprocessable | Well-formed but semantically rejected — typically server-side validation |
| 429 | Rate limited | Too many requests in a window — intermittent, depends on traffic |
| 500 | Server error | Unhandled exception on the backend — server logs are where the answer lives |
| 502 / 503 / 504 | Gateway / unavailable / timeout | Infrastructure layer — proxy, load balancer, or upstream service |
CORS errors are a separate category because they are not status codes — the browser blocks the request before the response reaches application code. A CORS failure shows up in the Network panel as a red entry with (failed) net::ERR_FAILED and a paired console error mentioning Access-Control-Allow-Origin. From the user's perspective the symptom is identical to a 500 — something didn't load — but the fix is a server-side header configuration, not application logic.
Beyond status codes, a handful of headers carry disproportionate weight in a bug report:
Authorization— what credentials the request carried. Redact before sharing, but note its presence or absence.Content-Type— mismatches between what the client sent and what the API expected are a common 400 cause.x-request-id/x-trace-id/x-correlation-id— most backends emit one. Include it in the bug title if you have it; it is the single fastest way for a developer to find the matching server-side log line.Set-Cookie— session creation, rotation, or invalidation. Redact the value but keep the cookie name andExpiresattribute.Retry-After— present on 429s and some 503s. Tells you whether the rate limit is per-second or per-day.Cache-Control/ETag— relevant for "stale data" bugs where the API is returning correct data but the browser is serving an old cache.
A bug report that names the failing endpoint, the status code, and the request-id is one a developer can start investigating without opening the HAR at all. The HAR is the proof; those three fields are the pointer.
Redacting HAR files before sharing
HAR files are uniquely dangerous artefacts because they capture everything. A raw HAR from a logged-in session is, in security terms, a transcript of every credential the user holds for that origin — bearer tokens, session cookies, API keys, refresh tokens, and any personally identifiable data that happened to ride the wire during the capture. Sharing one in a public Jira instance, a Slack channel with external collaborators, or a GitHub issue on an open-source repo is a credential leak.
The fields to remove or replace before sharing:
Authorizationheader values — usuallyBearer <jwt>orBasic <base64>. Replace the value with[REDACTED]but keep the header name so the developer knows auth was attempted.CookieandSet-Cookievalues — strip the cookie value, leave the name. Names likesession_idorcsrf_tokenare diagnostic; values are not.- Custom auth headers —
X-Api-Key,X-Auth-Token, anything in your team's auth scheme. The naming varies; review the header list for anything that looks credential-shaped. - PII in request and response bodies — emails, phone numbers, payment data, IDs that could be re-identified. Body redaction is the hardest part of HAR sanitation because the structure varies per endpoint.
- Query parameters carrying tokens — some APIs still accept tokens in the URL (
?api_key=...). The URL appears inrequest.url,entries[].pageref, and elsewhere; redact all occurrences.
For one-off bugs, a JSON-aware text editor and a find-and-replace is fast enough. For teams filing more than a handful of HAR-bearing reports a week, the manual review is the failure point — analysts forget, tokens leak, and security teams find out from a quarterly scan. Either standardise on tooling that filters by default (Chrome 130+ does this for cookies and Authorization; Crosscheck does it for the same plus custom headers configurable per team) or build a sanitiser into the bug-report submission script.
Attaching network logs to Jira, Linear, ClickUp, and Slack
Once the HAR is captured and redacted, getting it into the bug tracker has its own friction.
Jira accepts HAR files as standard attachments via drag-and-drop into the description editor or the attachment panel. The default attachment limit is 10 MB on Jira Cloud Free and configurable up to 2 GB on paid Jira instances, controlled by the global admin under General Configuration. Most HARs from a single bug reproduction land between 200 KB and 5 MB; the 12 MB Chrome truncation is the upper bound for a single browser-generated file. If you hit Jira's limit, the usual moves are to zip the HAR (it compresses well — JSON with repeated header names — typically 5x to 10x reduction) or attach it via a linked file storage service rather than directly.
Linear handles attachments through the same drag-and-drop flow but caps individual attachments at 10 MB on all plans. Zipping is the workaround.
ClickUp allows attachments up to 1 GB per file on every plan including Free, which makes it the most forgiving of the four for raw HAR uploads.
Slack caps files at 1 GB on paid plans and 1 GB on Pro as well, but a HAR pasted into a Slack thread loses the most important property a bug ticket has — durability. Use Slack for the conversation, attach the HAR to the actual ticket.
For all four trackers, the same rule applies: drop the HAR into the ticket itself, not into a separate channel. Tickets get archived, exported, and audited. Channels do not. A HAR that lives only in a Slack thread is a HAR that will not be there when someone investigates the same bug six months later.
Crosscheck's Jira bug-report automation guide covers the rest of the pipeline once the HAR is attached — status mapping, custom fields, and how to keep the description format consistent across reporters.
Before and after — what a bug report with a network log actually looks like
The difference is fastest to see side by side. Same bug, two reporters.
Without a network log:
Title: Checkout broken
Description: I tried to place an order and it didn't work. The button just spun and then nothing happened. I tried again twice. It's still broken. Using Chrome on macOS.
Steps:
- Add item to cart
- Click Checkout
- Wait
The developer's first reply is going to be some version of what does the network tab show — and there will be a 24-hour back-and-forth before any real work happens.
With a network log:
Title: Order submission fails with 500 —
POST /api/v1/orderson checkoutEnvironment: Chrome 134.0.6998.118 on macOS 15.4, production, build
1.42.7, user role:customer, request-idreq_01HX9N2P7K.Description: Submitting a valid cart returns 500 from the orders endpoint. The UI silently retries once and then settles into a spinning button without surfacing the error to the user. HAR attached (cookies and Authorization redacted).
Steps:
- Add SKU
WIDGET-002to cart- Click Checkout
- Observe
POST /api/v1/orders→ 500, payload{"error":"inventory_lock_timeout"}Expected: Order is created, user lands on confirmation page. Actual: 500 response, spinner persists, no error toast.
Attachments:
checkout-failure-2026-05-22.har(redacted)
The second ticket is investigable immediately. The endpoint is named. The status code and response body are quoted. The request-id will let the backend engineer find the matching server log line in one search. The HAR file is the proof — but the title and description alone are enough to start work.
The contrast is what justifies the discipline. The reporter spent maybe two extra minutes capturing and pasting; the developer saved a day of triage.
Capturing network logs automatically with Crosscheck
The manual DevTools workflow is the baseline. It is also, in practice, the thing that breaks down for most teams within a quarter. Three reasons it fails at scale:
The first is anticipation. A HAR only captures what happened while the panel was open. Intermittent bugs — the ones that matter most because they are hardest to fix — almost never get captured because the reporter wasn't already recording when the bug appeared. By the time DevTools is open, the relevant requests are gone.
The second is consistency. Preserve log, disable cache, "Save all as HAR with content" rather than "without", redaction before sharing — every step is a place a non-engineer can forget. Reports come in with truncated HARs, with credentials still in them, or with the wrong export format. The technical write-up is correct in theory and broken in practice.
The third is friction per report. Two extra minutes per bug looks small until a QA team is filing twenty bugs a day. That is an hour a day of pure ceremony.
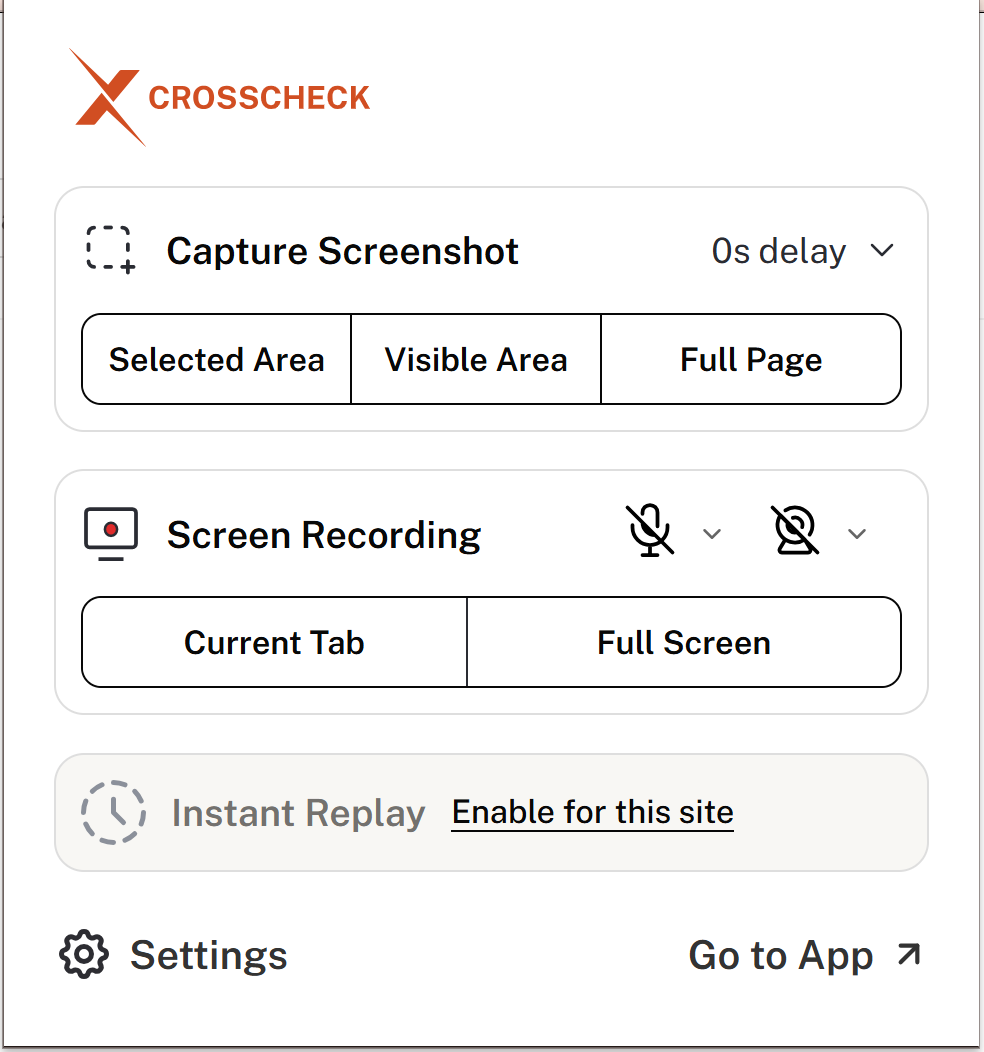
Crosscheck is a free Chrome extension that removes all three. Network logs are captured continuously in the background, so the evidence from an intermittent bug is already in the buffer when the reporter clicks Capture — no DevTools, no Preserve log toggle, no scramble to reproduce. Sensitive headers (Authorization, Cookie, and a configurable team list of custom auth headers) are filtered before the report is generated, so credentials don't leak by accident. The resulting bug report — screenshot or screen recording, console output, network requests, environment metadata, request-ids — lands in Jira, Linear, ClickUp, GitHub Issues, or Slack in a single click.
Crosscheck does not replace the DevTools network panel. For deep debugging the panel is still the right tool. What Crosscheck replaces is the manual evidence-capture step that has to happen on every bug report, every day, by every reporter — the step that breaks first.
For teams already doing the rest of the bug-report work well, this is the missing layer. The perfect bug report template covers what the other fields should look like; the console logs guide covers the matching browser-side evidence; this guide covers the network half.
FAQ
How do I capture a network log if the bug happened before I opened DevTools?
You cannot — manually. DevTools only records requests made while the Network panel is open, so anything that happened earlier is gone and you need to reproduce the bug to capture it. Browser extensions that buffer requests in the background, like Crosscheck, can capture retroactively because they are running before the bug occurs.
What is the difference between a HAR file and a network log?
A network log is the live list of requests you see in DevTools. A HAR file is the serialised export of that log as a JSON document. Same data, different container. When a developer asks for a "network log", a HAR is almost always what they want.
Are HAR files safe to share?
Not by default. A raw HAR contains every cookie, token, and credential the browser sent during capture. Chrome 130 and later automatically redact Cookie and Authorization headers on export, but Firefox, Safari, and earlier Chrome do not. Always assume a HAR is credential-bearing until you have manually verified otherwise or generated it with a tool that filters by default.
How large can a HAR file get?
Chrome caps exports at roughly 12 MB and truncates beyond that, which can produce invalid JSON on the tail end. Firefox defaults to 1 MB per response body unless you flip a devtools.netmonitor.har.includeResponseBodies preference. For most single-bug reproductions HARs land between 200 KB and 5 MB and zip down well — JSON compresses by 5x to 10x because of repeated header names.
Can I attach a HAR to a Linear or Jira ticket directly?
Yes for both. Jira Cloud's default limit is 10 MB on Free and configurable up to 2 GB on paid; Linear caps at 10 MB across all plans. If you hit the limit, zip the HAR first — the compression ratio almost always brings it under. ClickUp allows up to 1 GB on every plan.
When should I use a HAR file vs a screen recording?
Use both. A screen recording shows what the user saw; a HAR shows what the browser did. The recording proves the bug exists. The HAR proves what caused it. For any bug that involves an API call, data load, or form submission, the network log is the artefact a developer will read first. See the screen recording guide for when the recording is the primary evidence.
Start capturing network logs on every bug report
Network logs are the highest-leverage piece of evidence in a bug report, and the one most commonly missing. The DevTools workflow works once you know it — but for a team filing bugs daily, the steps add up and the intermittent cases slip through. Crosscheck attaches the network log automatically to every bug report, with credentials filtered by default, then ships the whole package to Jira, Linear, ClickUp, GitHub Issues, or Slack in one click.